Tree Reporter
The tree reporter provides a simplified representation of the call hierarchy of the tracked process at the time when its memory usage was at its peak.
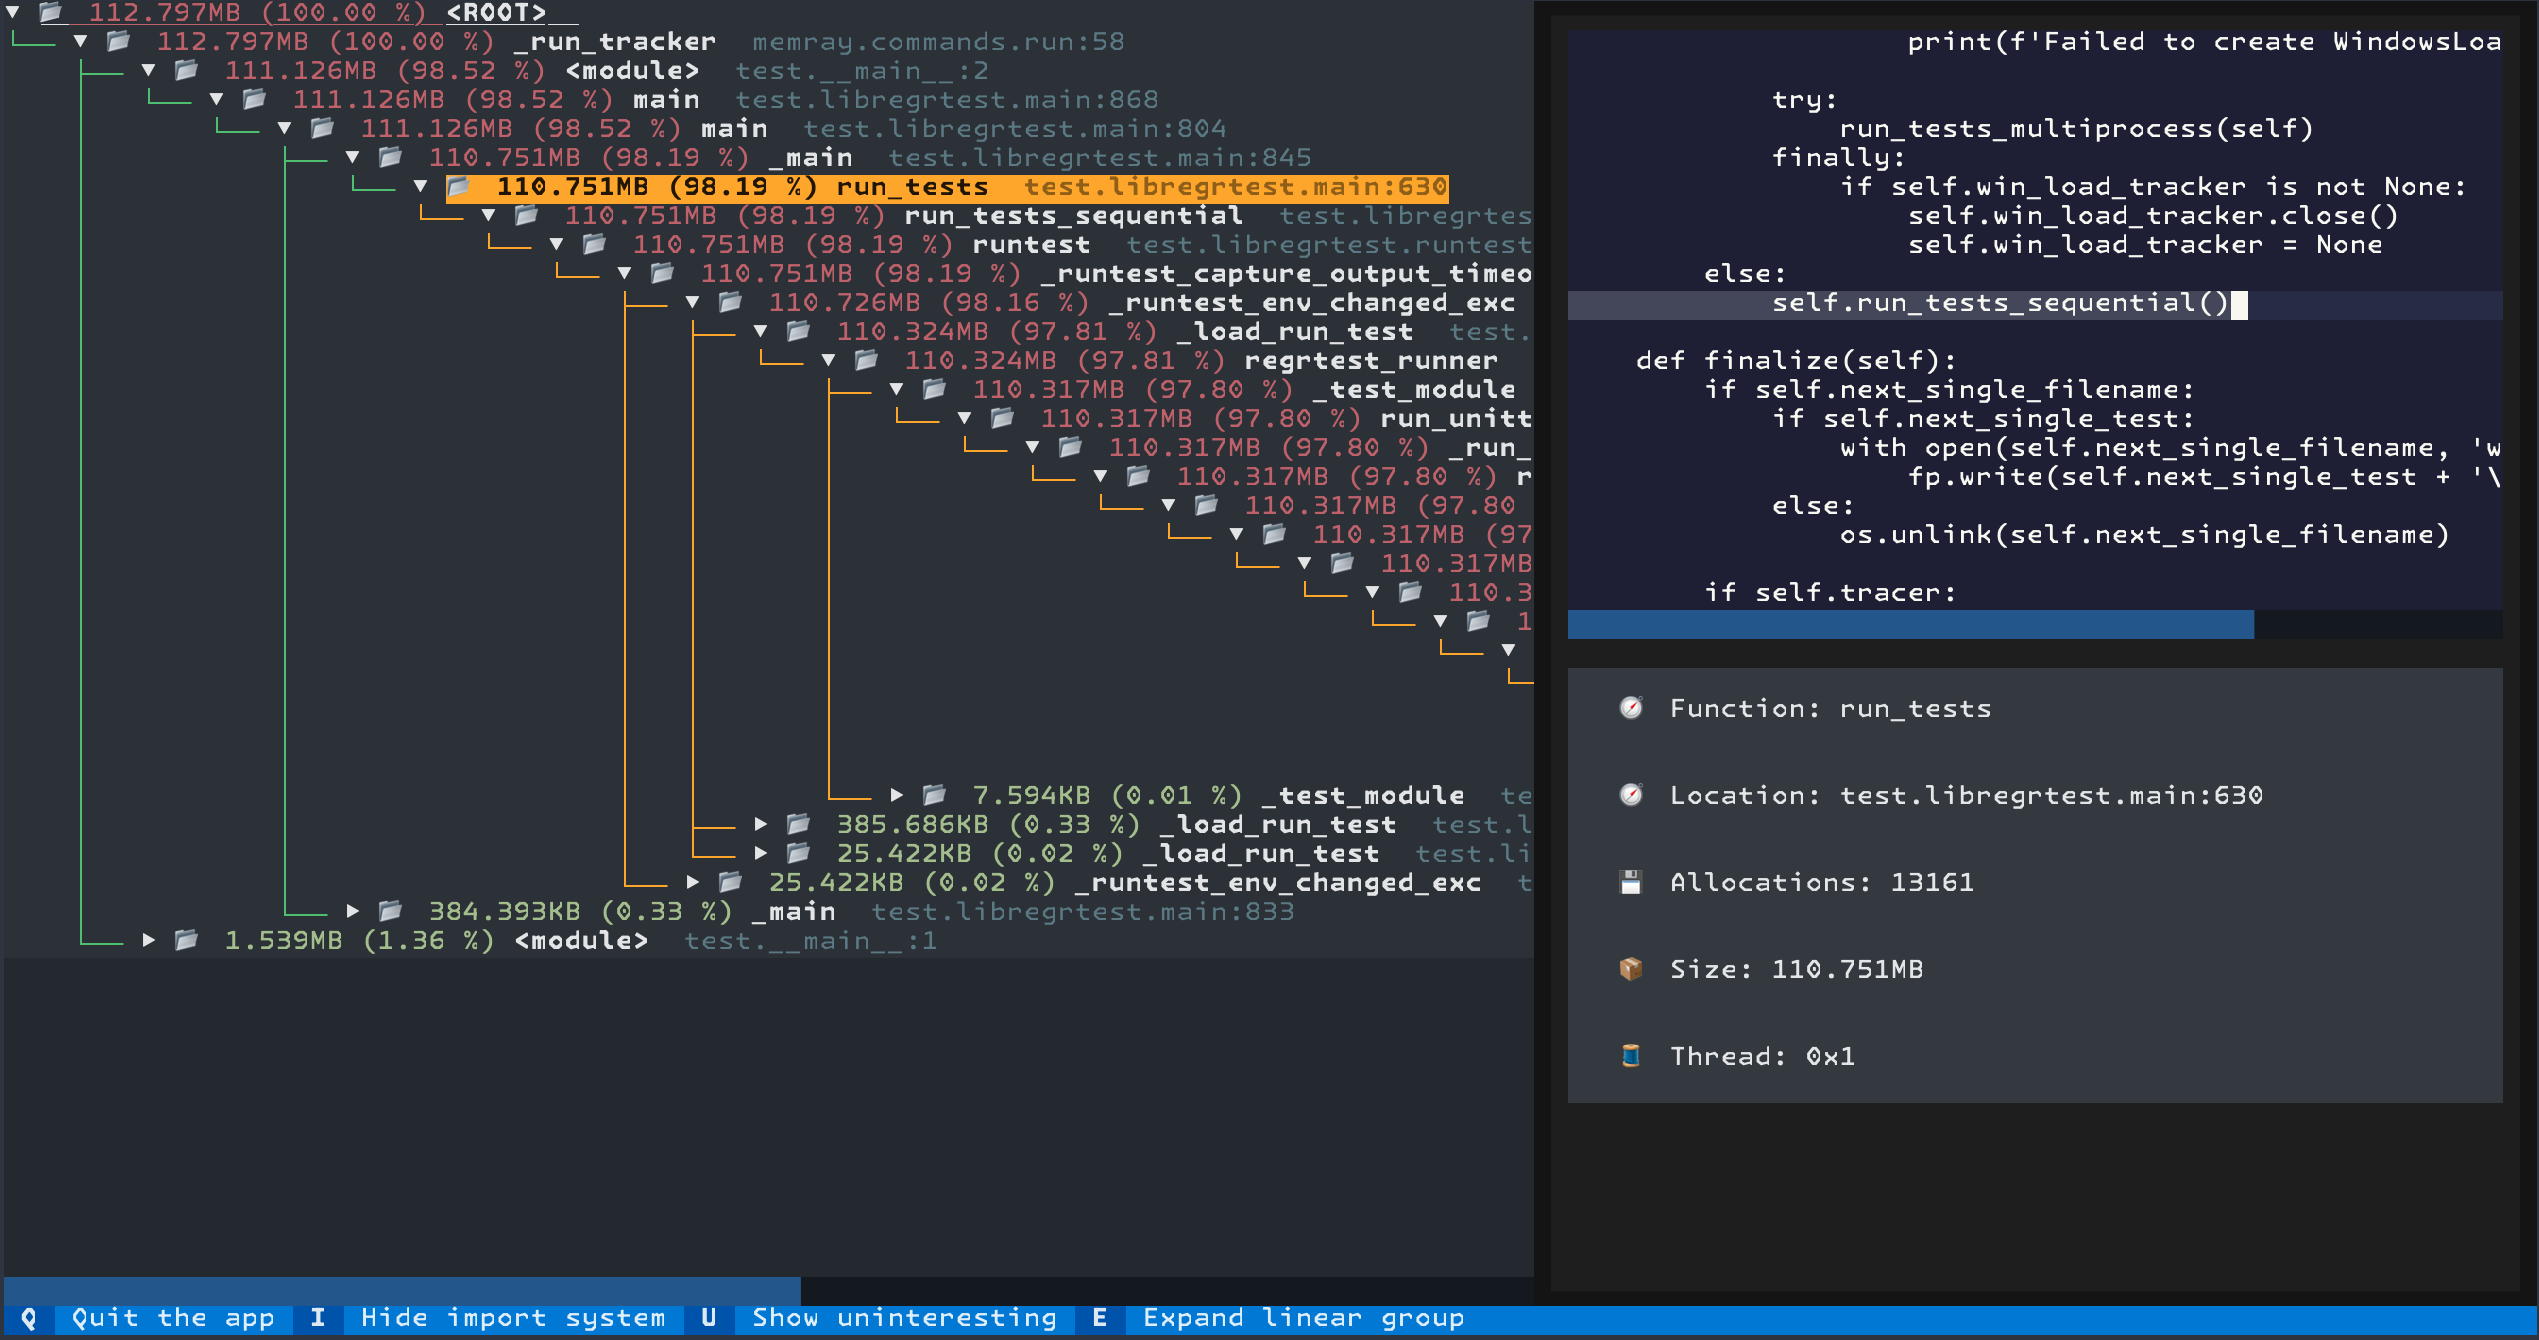
The tree reporter shows an interactive terminal applocation displaying a tree representation of the allocated memory. Several aspects are important when interpreting the tree representation:
Only the 10 source locations responsible for the most allocated bytes are displayed. This is configurable with the
--biggest-allocscommand line parameter.The total memory and percentage shown in the root node of the tree are calculated based only on the allocations that are shown. Since any allocation not big enough to be shown will not be included there, the reported total memory of the root node is normally less than the process’s peak memory size.
The “📂” icon represents a frame that is a caller of a function where an allocation happened while the “📄” icon represents a frame that allocated memory.
Frames are colored based on their reported memory usage percentage, from red (most bytes allocated) to green (fewest).
You can interact with the application using the following keys:
You can navigate the tree using the arrow keys. Pressing the up arrow key will move up one level in the tree, while pressing the down arrow key will move down one row. When a new row is selected, the panel on the right will be updated to show the source code of the selected frame and some metadata about the allocations made by that frame and its children.
Pressing the ‘e’ key will expand nodes and their children recursively until a node with more than one child is found. This can be used to quickly expand the tree.
Pressing the ‘i’ key will hide all nodes that belong to the import system and their children.
Presing the ‘u’ key will show all nodes that are marked as “uninteresting”.
Note
If the textual[syntax] package is installed, the Python source files
will be displayed with syntax highlighting!
Basic Usage
The general form of the tree subcommand is:
memray tree [options] <results>
The only argument the tree subcommand requires is the capture file
previously generated using the run subcommand.
The output will be printed directly to standard output. If standard output is a terminal, the output will be colorized.
CLI Reference
Generate a tree view in the terminal for peak memory usage
usage: memray tree [-h] [-b BIGGEST_ALLOCS]
                   [--temporary-allocation-threshold N | --temporary-allocations]
                   results
Positional Arguments
- results
Results of the tracker run
Named Arguments
- -b, --biggest-allocs
Show n biggest allocations (defaults to 200)
Default:
200- --temporary-allocation-threshold
Report temporary allocations, as opposed to leaked allocations or high watermark allocations. An allocation is considered temporary if at most N other allocations occur before it is deallocated. With N=0, an allocation is temporary only if it is immediately deallocated before any other allocation occurs.
Default:
-1- --temporary-allocations
Equivalent to --temporary-allocation-threshold=1
Please submit feedback, ideas, and bug reports by filing a new issue at https://github.com/bloomberg/memray/issues