Python allocators
Python has a layer of abstraction between code that allocates memory and the
system allocator (malloc, free, realloc, etc). Although the system allocator is
quite fast and efficient, it is still generic and is not tuned to the specific
allocation patterns of the Python interpreter, especially those regarding small
Python objects. To improve performance and reduce fragmentation, Python has
a specialized allocator that handles allocation of small objects and defers to
the system allocator for large ones. This allocator is called pymalloc.
How pymalloc works
Requests greater than 512 bytes are routed to the system’s allocator. This
means that even if pymalloc is active, it will only affect requests for 512
bytes or less. For those small requests, the pymalloc allocator will
allocate big chunks of memory from the system allocator and then subdivide
those big chunks.
pymalloc works with 3 hierarchical data structures:
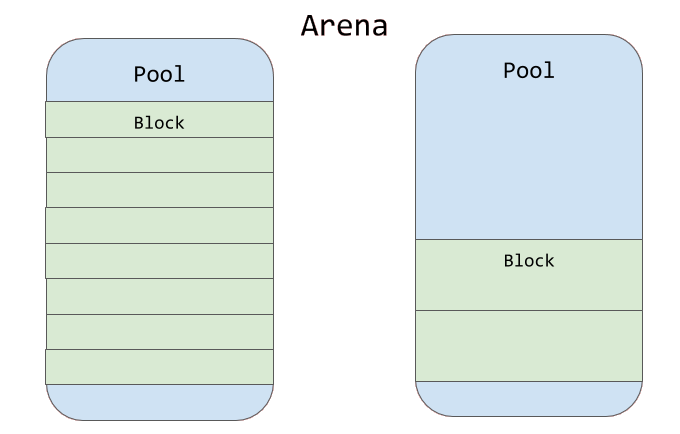
Arenas: These are chunks of memory that
pymallocdirectly requests from the system allocator usingmmap. Arenas are always a multiple of 4 kilobytes. Arenas are subdivided into pools of different types.Pools: Pools contain fixed size blocks of memory. Each pool only contains blocks of a single consistent size, though different pools have blocks of different sizes. Pools are used to easily find, allocate, and free memory blocks of a given size.
Blocks: These are the fundamental units of storage. Small allocation requests to
pymallocare always satisfied by returning a pointer to a specific block. This block can be bigger than what the allocation requested.
When the user code is done with a block, it is marked as unused. When all blocks in a pool have been marked as unused, the pool is marked as unused. Only when all pools in an arena have been marked as unused can the arena be returned to the system allocator. This rarely happens.
The following table shows the relationship between the allocation request and the actual block size that will be returned:
Allocation request to block size |
||
|---|---|---|
Request in bytes |
Size of allocated block |
Size class index |
1-8 |
8 |
0 |
9-16 |
16 |
1 |
17-24 |
24 |
2 |
25-32 |
32 |
3 |
33-40 |
40 |
4 |
41-48 |
48 |
5 |
49-56 |
56 |
6 |
57-64 |
64 |
7 |
65-72 |
72 |
8 |
… |
… |
… |
497-504 |
504 |
62 |
505-512 |
512 |
63 |
As indicated before, any request for more than 512 bytes will be made directly using the system allocator.
How does this affect memory profiling?
Memory profiling with pymalloc active can yield some surprising results.
This is because when a request for memory comes, pymalloc will try to reuse
existing memory that has previously been used for other Python objects. This
has two main consequences:
Requests for small amounts of memory that can be satisfied from an existing arena won’t result in a call to the system allocator and therefore won’t appear in the profiler reports at all.
Requests for small amounts of memory that can’t be satisfied from an existing arena will result in a new arena being allocated from the system allocator, which will be shown as an
mmaprequest whose size is a multiple of 4 kilobytes.
This may look confusing, and you may wish to deactivate pymalloc when
profiling memory, but that is not necessarily a good idea. When your
application runs, it normally runs with pymalloc activated, which means
that any allocation patterns that you see when profiling with pymalloc
activated correspond exactly to what your application will be doing.
Note
If you are interested in why your application is using a lot of memory, you
usually want to profile it exactly how it is normally executed, so you
usually want pymalloc to be active.
There are some cases when pymalloc gets in the way, though. For instance,
if you are hunting memory leaks using the --leaks option of some of the
memray reporters, then having pymalloc active during profiling makes
this task more difficult.
Note
When hunting for memory leaks using the --leaks option, you want to
see every allocation and deallocation independently, so you usually want
pymalloc deactivated.
Because pymalloc may not release all memory to the system even if you have
finished using it, the profiler will incorrectly report it as leaked. You’ll
also be misled about the size of the leak, since the size of the leaked
allocation will be reported as the size of the arena (some multiple of
4 kilobytes), rather than the size of the leaked object (never more than 512
bytes). Also, if just one block owned by an arena is leaked, that will prevent
the arena from being returned to the system allocator, but you won’t be able to
tell which object was leaked, since a single arena can be used to satisfy many
allocation requests from many places, and only the place where the arena was
created by requesting more memory from the system will have been recorded.
Caution
Note that running without pymalloc will result in slower executions
and much bigger report files, as many extra allocations will be seen.
How can I deactivate pymalloc
To deactivate pymalloc you can set the PYTHONMALLOC=malloc environment
variable or execute Python with -Xdev. Or, you can pass the
--trace-python-allocators flag to memray run so that, even though
pymalloc is still used, Memray sees every call to the pymalloc
allocator instead of only the ones where it needs to make a request to the
system allocator.