Memory overview
Heap memory vs resident memory
When you are profiling memory usage, you will often see two different metrics: heap memory and resident memory.
Resident memory corresponds to the memory that is allocated currently in your main memory or RAM. Generally speaking, programs will store most of the memory they are using in main memory but there are some caveats you need to be aware of if you want to make sense of how your programs are using memory. Resident memory is a metric that is not independent of the other programs that are running concurrently and what’s happening in your machine. This means that two identical runs of your program can have very different resident memory measurements. If the OS determines that other programs or tasks have higher priority than the one you are analyzing, it may move some of the memory used by the program to swap space. This means that resident memory usage in your program may decrease (and increase later) even if you don’t free or allocate any memory yourself.
This makes resident memory a tricky metric to make sense of. On the one hand it is a good indicator of what may be causing your machine to run out of memory. Ultimately this is the memory that is limited by the amount of RAM (and swap space) you have. But on the other hand the value of resident memory associated with a given program is dependent on all the other programs that are running concurrently so it may be a bit difficult to properly diagnose why it decreases or increases.
Memory is lazily allocated
What makes it even more complicated to properly relate heap memory and resident
memory is that memory is lazily allocated by the OS. For example, if you call
one the system allocator APIs (malloc for example), it may return instantly
without actually allocating memory at all. It still will give you a pointer to a
chunk of memory that you can use, but memory will only be allocated when you write to that pointer.
malloc promises you the memory chunk but you only get it for real when you
really need it. This means that heap memory will increase as soon as the
allocator API is called but resident memory will only increase once you actually
write to that memory.
For instance, consider this code:
import time
import numpy
time.sleep(1)
big_array = numpy.empty(1_000_000)
time.sleep(1)
big_array[:] = 42.0
time.sleep(1)
If you run memray against this code and generate a flamegraph, you will see
the following plot:
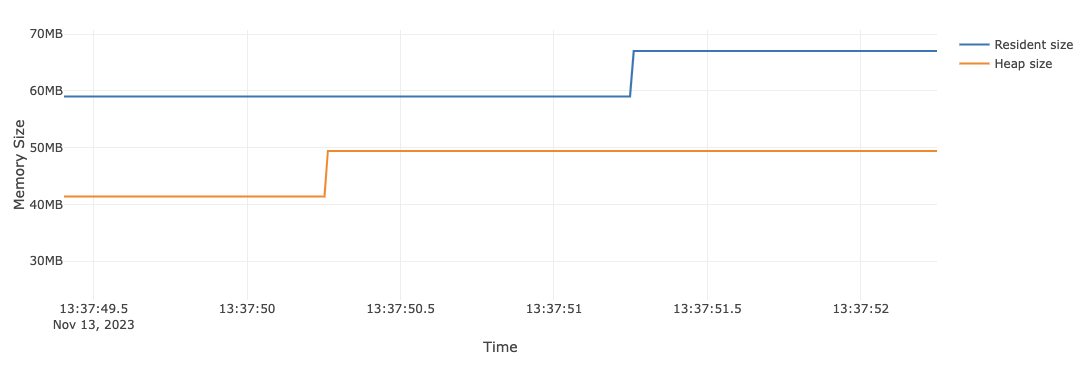
As you can see in the plot, the line for the heap size increases first
(corresponding to the call to numpy.empty) but the resident size does not
increase inmediately. Instead, the resident size only increases after we have
populated the whole array with floating point numbers. Is only at this moment
when the OS will actually allocate the necessary memory pages to satisfy our
initial request. Notice that this happens when memory is written to the
array, so a memory profiler won’t be able to tell you what makes the resident
size grow as it doesn’t have visibility into when pages are actually assigned.
Memory is not freed immediately
Another thing that makes difficult to relate heap memory and resident memory is
that memory is not freed immediately after it is no longer needed. This is
because the system allocator may not release the memory to the OS when it is no
longer needed. This means that once you call a deallocator API (free for
example), the implementation may not free the memory for real until later. This means
that you may see the heap size decrease but the resident memory size may
not decrease yet.
For instance, consider this code:
import time
import numpy
time.sleep(1)
big_array = numpy.empty(1_000_000)
time.sleep(1)
big_array[:] = 42.0
time.sleep(1)
del big_array
time.sleep(1)
If you run memray against this code and generate a flamegraph, you will see the following the following plot:
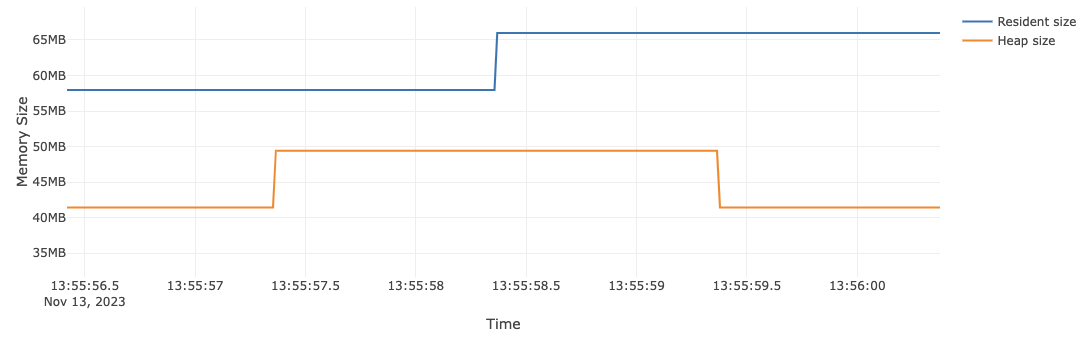
As you can see in the plot, the line for the heap size decreases after we delete
the array (corresponding to the call to del) but the resident size does not
decrease inmediately. Instead, the resident size will only decrease (not shown
in this plot) after the system allocator determines that it is a good idea to free
the memory pages. Notice that this happens when pages are released, so a
memory profiler won’t be able to tell you what makes the resident size
decrease as it doesn’t have visibility when pages are actually unmapped.
Memory can be fragmented
Another thing that makes it difficult to relate heap memory and resident memory is that memory can be fragmented. This means that the memory that is allocated by the system allocator may be spread around the address space in different fragments. This means that the resident memory size will increase/decrease in unpredictable ways. This happens because the system allocator may not be able to reuse memory that has been freed before.
Memory fragmentation results in seemingly unnecessary requests to the OS for more memory. Even when the sum of the space already available for the memory allocator is large enough to satisfy a memory allocation request, it’s possible no individual fragment (or set of contiguous fragments) is large enough to satisfy that memory allocation request. Memory fragmentation is caused by a combination of the allocation strategy used by the allocator you are using, the sizes and alignments of the internal structures, and the memory allocation behavior of your application.
Detecting fragmentation is a very difficult task because it depends on the system
allocator that you are using. If you are using GLIBC’s malloc for example,
you can use the malloc_stats API to get information about the memory
allocator. This API will give you information about the number of free chunks
and the total size of the free chunks. If you see that the number of free chunks
is large but the total size of the free chunks is small, then you may be
suffering from memory fragmentation. You can read more about this in the man
page.
Although this API must be called from native code, you can use the ctypes module to call it from Python. For example, you can use the following code to call it from Python:
import ctypes
libc = ctypes.CDLL("libc.so.6")
libc.malloc_stats.restype = None
libc.malloc_stats()
Another option is to use GLIBC’s malloc_info API. This API will give you
information about the memory allocator in a format that is easier to parse from
programs. As with the other API, you can use the ctypes module
to call it from Python.
import ctypes

class MallInfo(ctypes.Structure):
    _fields_ = [
        (name, ctypes.c_int)
        for name in (
            "arena",
            "ordblks",
            "smblks",
            "hblks",
            "hblkhd",
            "usmblks",
            "fsmblks",
            "uordblks",
            "fordblks",
            "keepcost",
        )
    ]


libc = ctypes.CDLL("libc.so.6")
mallinfo = libc.mallinfo
mallinfo.argtypes = []
mallinfo.restype = MallInfo

info = mallinfo()
fields = [(name, getattr(info, name)) for name, _ in info._fields_]
print("Malloc info:")
for name, value in fields:
    print(f"- {name}: {value}")