Symbolic information in native mode
Important
For the best native mode experience, we recommend running your program on Linux using an interpreter and libraries built with as much debugging information as possible.
When passing the --native flag to the the run subcommand,
Memray will collect information about the native call stack leading to each
allocation, and it will dump it to the result file. This information is in
a raw form where every call is identified by a number called the “instruction
pointer” or “program counter”. The instruction pointer is a number that helps
running programs identify what CPU instruction needs to be executed next. After
fetching each instruction the instruction pointer is incremented, and holds the
memory address of (“points to”) the next instruction to be executed. Processors
usually fetch instructions sequentially from memory, but control transfer
instructions change the sequence by placing a new value in the instruction
pointer. These include branches (sometimes called jumps), subroutine calls, and
returns. A transfer that is performed only if some condition is true allows the
computer to follow a different sequence under different conditions.
When creating reports, Memray needs to convert these instruction pointers into human readable information, like the function name, the file name where that function is defined, and the line number within that file corresponding to the instruction. This process is known as symbolification.
How Memray resolves symbols
There are two different approaches Memray uses to symbolify an instruction pointer:
Use the DWARF debugging information embedded in the executable or shared library containing the instruction. This process will provide function names, file names, and line numbers, and will also be able to resolve inlined functions. This method is used whenever debugging information is available.
Use the symbol table information embedded in the executable or shared library containing the instruction. This is a suboptimal method that will only provide function names, not file names or line numbers. It can also be unreliable as the symbol table may not contain entries for every function.
Attention
To reduce tracking overhead, Memray delays symbolification until reports are being generated. This means that when a report is being generated, Memray needs to read information from the interpreter executable that was used to run the tracked application, and from the shared libraries that were loaded into it. Reports must be generated on the same machine that the application ran on, because the same versions of the interpreter and shared libraries need to be available for inspection. Failing to do this will result in symbolification errors or incorrect reports.
If Memray is able to resolve file names, line numbers, and inline functions, it can hide some of the Python interpreter’s internal functions which don’t add much information to the report. If there is no debug information available then the produced flame graphs will look more noisy and be harder to read, because we won’t be able to reliably detect these uninteresting functions. In these images you can compare two flame-graphs, one with debug information and one without debug information, produced from the same capture file:
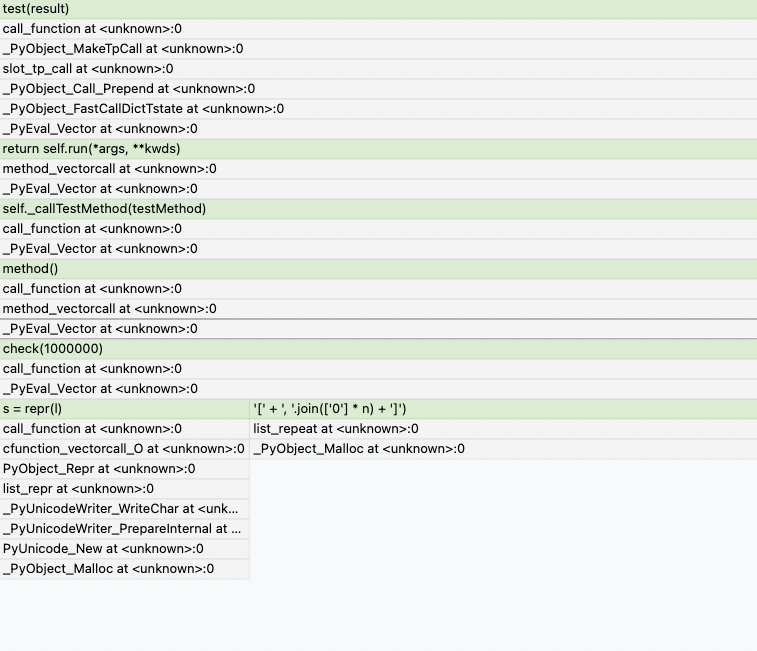
Flamegraph in native mode produced without debug information.¶ |
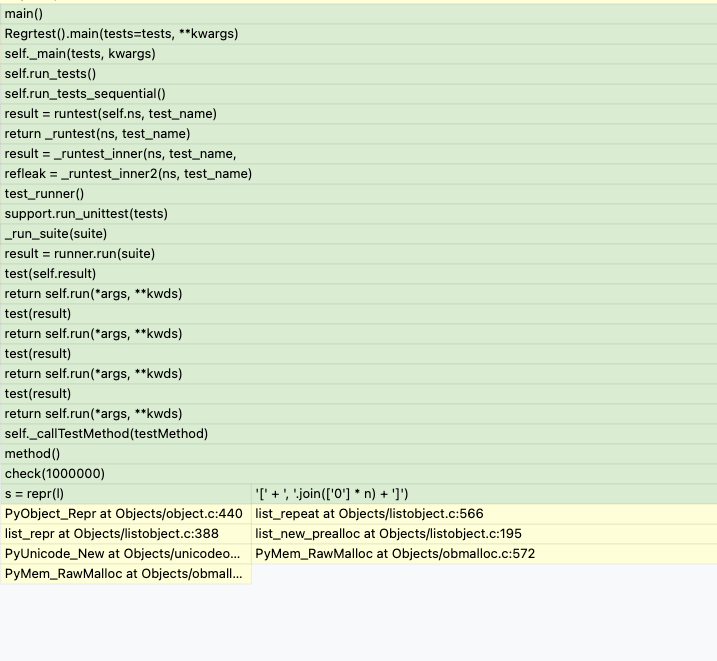
Flamegraph in native mode produced with debug information.¶ |
You can see that file names are reported as <unknown> and line numbers as
0 when debugging information is not available.
On Linux, you can check whether your binaries have DWARF debug information available by running:
$ readelf -S ./a.out | grep debug
For example, for checking if the Python interpreter has DWARF debug information available:
$ readelf -S $(which python) | grep debug

[26] .debug_aranges    PROGBITS         0000000000000000  00001057
[27] .debug_info       PROGBITS         0000000000000000  00001087
[28] .debug_abbrev     PROGBITS         0000000000000000  000010de
[29] .debug_line       PROGBITS         0000000000000000  0000111a
[30] .debug_str        PROGBITS         0000000000000000  00001177
[31] .debug_macro      PROGBITS         0000000000000000  00003eb1
Symbolification in macOS
Caution
Because most macOS binaries for Python don’t include debug information, reports produced in macOS can be much less accurate.
On Mac OS X there was a decision to not have the linker include all of the
debug information into the executables and libraries it builds. Instead, the
compiler generates the DWARF debug information in the .s files, the
assembler outputs it in the .o files, and the linker includes a “debug map”
in the executable or shared library which tells debug info users where all of
the symbols were relocated during the link. There is a tool called dsymutil
that can read the debug map, load the DWARF information from the .o files,
relocate all the addresses and then output a single binary with all the DWARF
information at their final, linked addresses. This final binary is called
a dSYM bundle and is normally placed alongside every executable.
This process has some advantages, but unfortunately in the Python world neither redistributors of Python interpreters nor library maintainers generally package debugging information with the binaries. This means that most macOS binaries don’t have debug information inside, so in general native mode symbolification will not work well in macOS.
Memray will fall back to symbol table analysis if it can’t find any debug information in the binary, but when producing reports we won’t be able to identify where the different symbols came from, making flame graphs very verbose and hard to read.
Adding debugging information to your native extension
If you are debugging your own native extension, you can generate debug
information that Memray can use by executing dsymutil on your shared object
while the object files used to generate the shared object still exist. For
instance, for the Memray extension itself (the paths will be different for your
own extension):
$ # Sanity check: ensure that the object files are still around
$ dsymutil -s  src/memray/_memray.cpython-310-darwin.so | grep OSO | head -n 1
[  9431] 000d39a1 66 (N_OSO        ) 00     0001   0000000062fb8052 'memray/build/temp.macosx-12.5-arm64-cpython-310/src/memray/_memray.o'

$ ls memray/build/temp.macosx-12.5-arm64-cpython-310/src/memray/_memray.o
.rw-r--r-- 3.5M pgalindo3 16 Aug 12:32 memray/build/temp.macosx-12.5-arm64-cpython-310/src/memray/_memray.o

$ # Then generate a dSYM bundle with the debug information:
$ dsymutil src/memray/_memray.cpython-310-darwin.so
This will place a new file called _memray.cpython-310-darwin.dSYM in the
same directory as the original shared object. Once this file is in place,
memray will be able to leverage the debug information it contains.
Debuginfod integration
Memray can use debuginfod to fetch debug information from remote servers on demand. This is useful because many Linux distributions don’t ship debug information with their binaries, so you can use debuginfod to download the debug information from a server that does have it. Many modern Linux distributions have debuginfod integration so you can take advantage of this with little to no effort.
To take advantage of debuginfod, you need two things:
The
debuginfodclient library must be installed. This library allows you to query debuginfod servers. It is available in most Linux distributions (including Debian, Ubuntu, Fedora, Arch Linux, etc.) and can be installed with your package manager. For example, in Debian/Ubuntu:$ sudo apt install debuginfod
In Arch Linux:
$ sudo pacman -S debuginfod
In Fedora:
$ sudo dnf install elfutils-debuginfod
The
DEBUGINFOD_URLSenvironment variable must point to the debuginfod server you want to use. This is a space separated list of URLs. For example:$ export DEBUGINFOD_URLS="https://debuginfod.archlinux.org/"
Tip
You can also use https://debuginfod.elfutils.org/ which works as a federated server and queries all available debuginfod servers.
Some modern Linux distributions set this variable by default when the
debuginfodclient is installed, so you may not need to set this up.
Once the client is installed and the environment variable is set, Memray will automatically use debuginfod to download debug information for the binaries it encounters when generating native mode reports. The first time that Memray uses debuginfod to fetch debug information it will take a bit longer to generate the report, but subsequent runs will be much faster because the debug information gets cached locally.
If you’d like to see progress diagnostics during downloads, set:
$ export DEBUGINFOD_PROGRESS=1
If you want to see exactly which network requests are being made and which
cached files are used you can set $DEBUGINFOD_VERBOSE (warning: it is
very verbose):
$ export DEBUGINFOD_VERBOSE=1
If you want to limit download times and/or sizes you can set these variables:
$ export DEBUGINFOD_TIMEOUT=10       # seconds
$ export DEBUGINFOD_MAXSIZE=1000000  # bytes
If you never want to query a debuginfod server, clear the $DEBUGINFOD_URLS
environment variable:
$ unset DEBUGINFOD_URLS
If you have a local debuginfod cache that you’d like to use, but don’t want to
attempt any upstream debuginfod queries, set $DEBUGINFOD_URLS to something
non-empty but ineffective, such as /dev/null.
Tip
Clients automatically clean the cache of files not accessed in a while. You
may also remove the debuginfod cache directory
$HOME/.cache/debuginfod_client at any time to clear space.