Summary Reporter
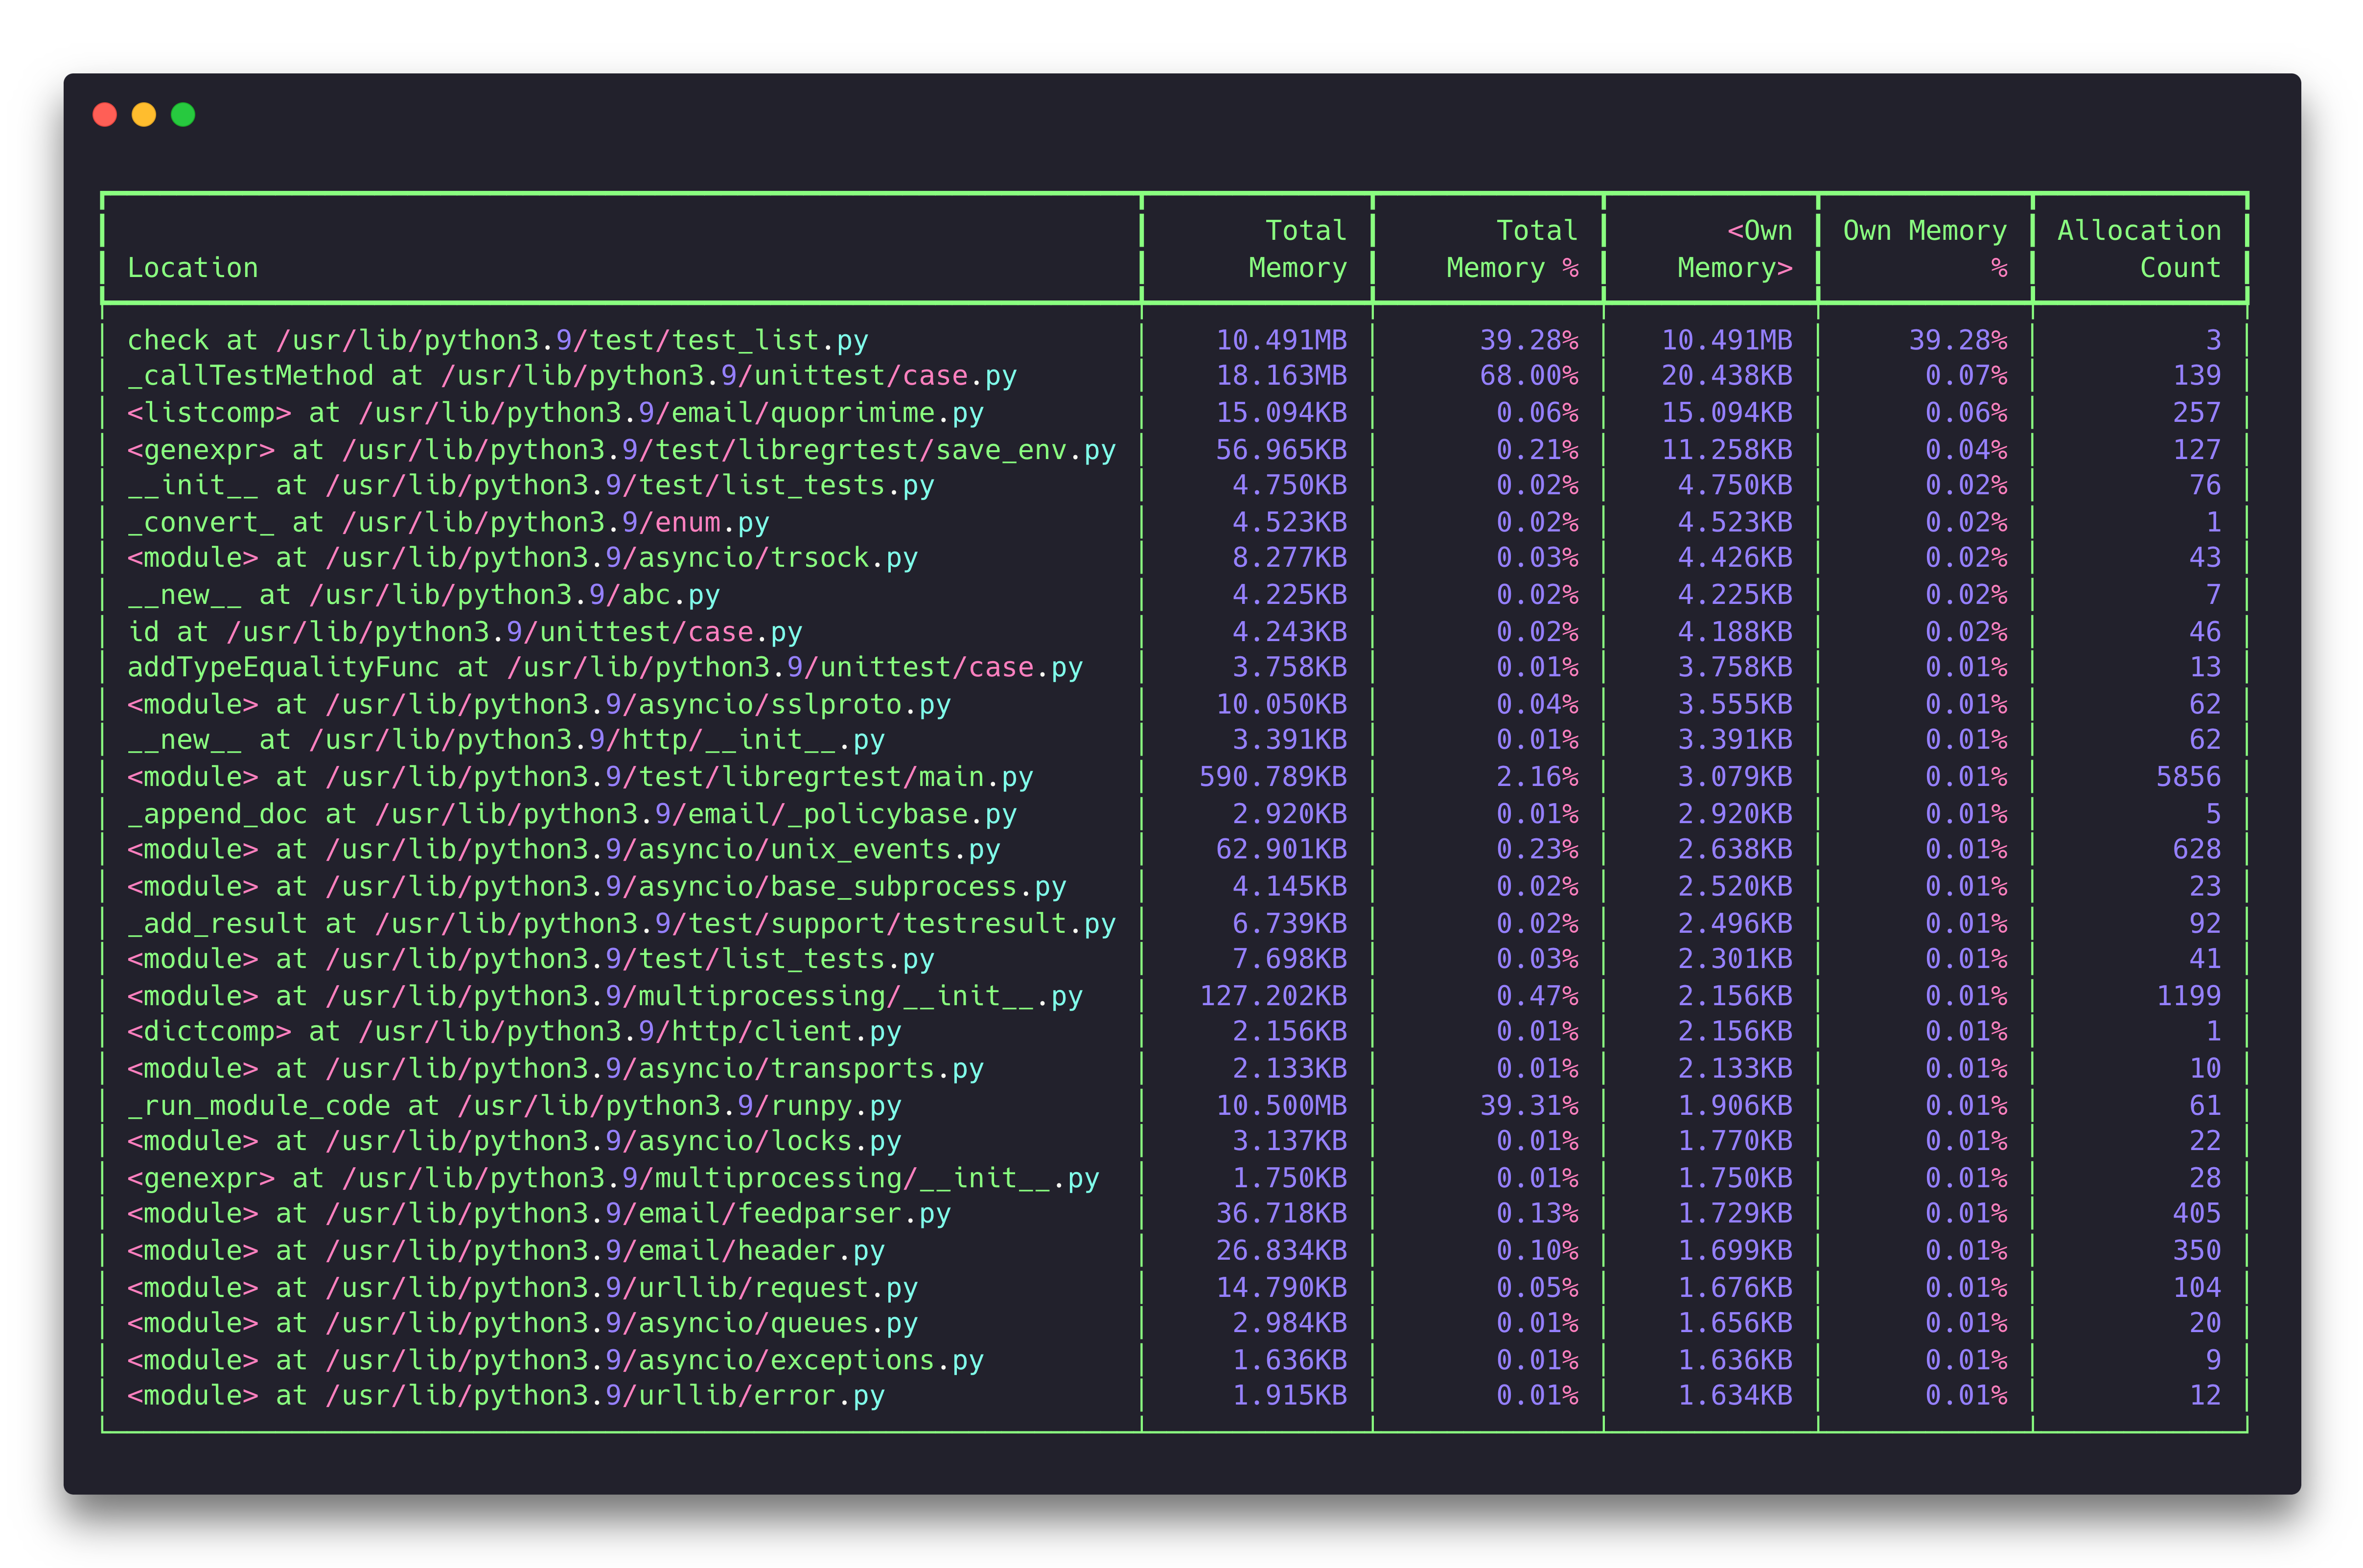
The summary reporter provides a quick overview of allocated memory at the time when the tracked process’s memory usage was at its peak. It displays a table showing how much of that peak memory each function directly allocated (“own memory”), how much was cumulatively allocated by that function and everything it called (“total memory”), and the cumulative count of not yet freed allocations performed by that function and everything it called (“allocation count”). Allocations for different threads are aggregated together and shown in the same table.
Basic Usage
The general form of the summary subcommand is:
memray summary [options] <results>
The only argument the summary subcommand requires is the capture file
previously generated using the run subcommand.
The output will be printed directly to standard output. If standard output is a terminal, the output will be colorized.
CLI Reference
Generate a terminal-based summary report of the functions that allocate most memory
usage: memray summary [-h] [-s SORT_COLUMN] [-r MAX_ROWS]
                      [--temporary-allocation-threshold N | --temporary-allocations]
                      results
Positional Arguments
- results
Results of the tracker run
Named Arguments
- -s, --sort-column
Column number to sort on
Default:
1- -r, --max-rows
Maximum number of rows to display
- --temporary-allocation-threshold
Report temporary allocations, as opposed to leaked allocations or high watermark allocations. An allocation is considered temporary if at most N other allocations occur before it is deallocated. With N=0, an allocation is temporary only if it is immediately deallocated before any other allocation occurs.
Default:
-1- --temporary-allocations
Equivalent to --temporary-allocation-threshold=1
Please submit feedback, ideas, and bug reports by filing a new issue at https://github.com/bloomberg/memray/issues