Stats Reporter
The stats reporter generates high level statistics about the tracked process’s memory allocations.
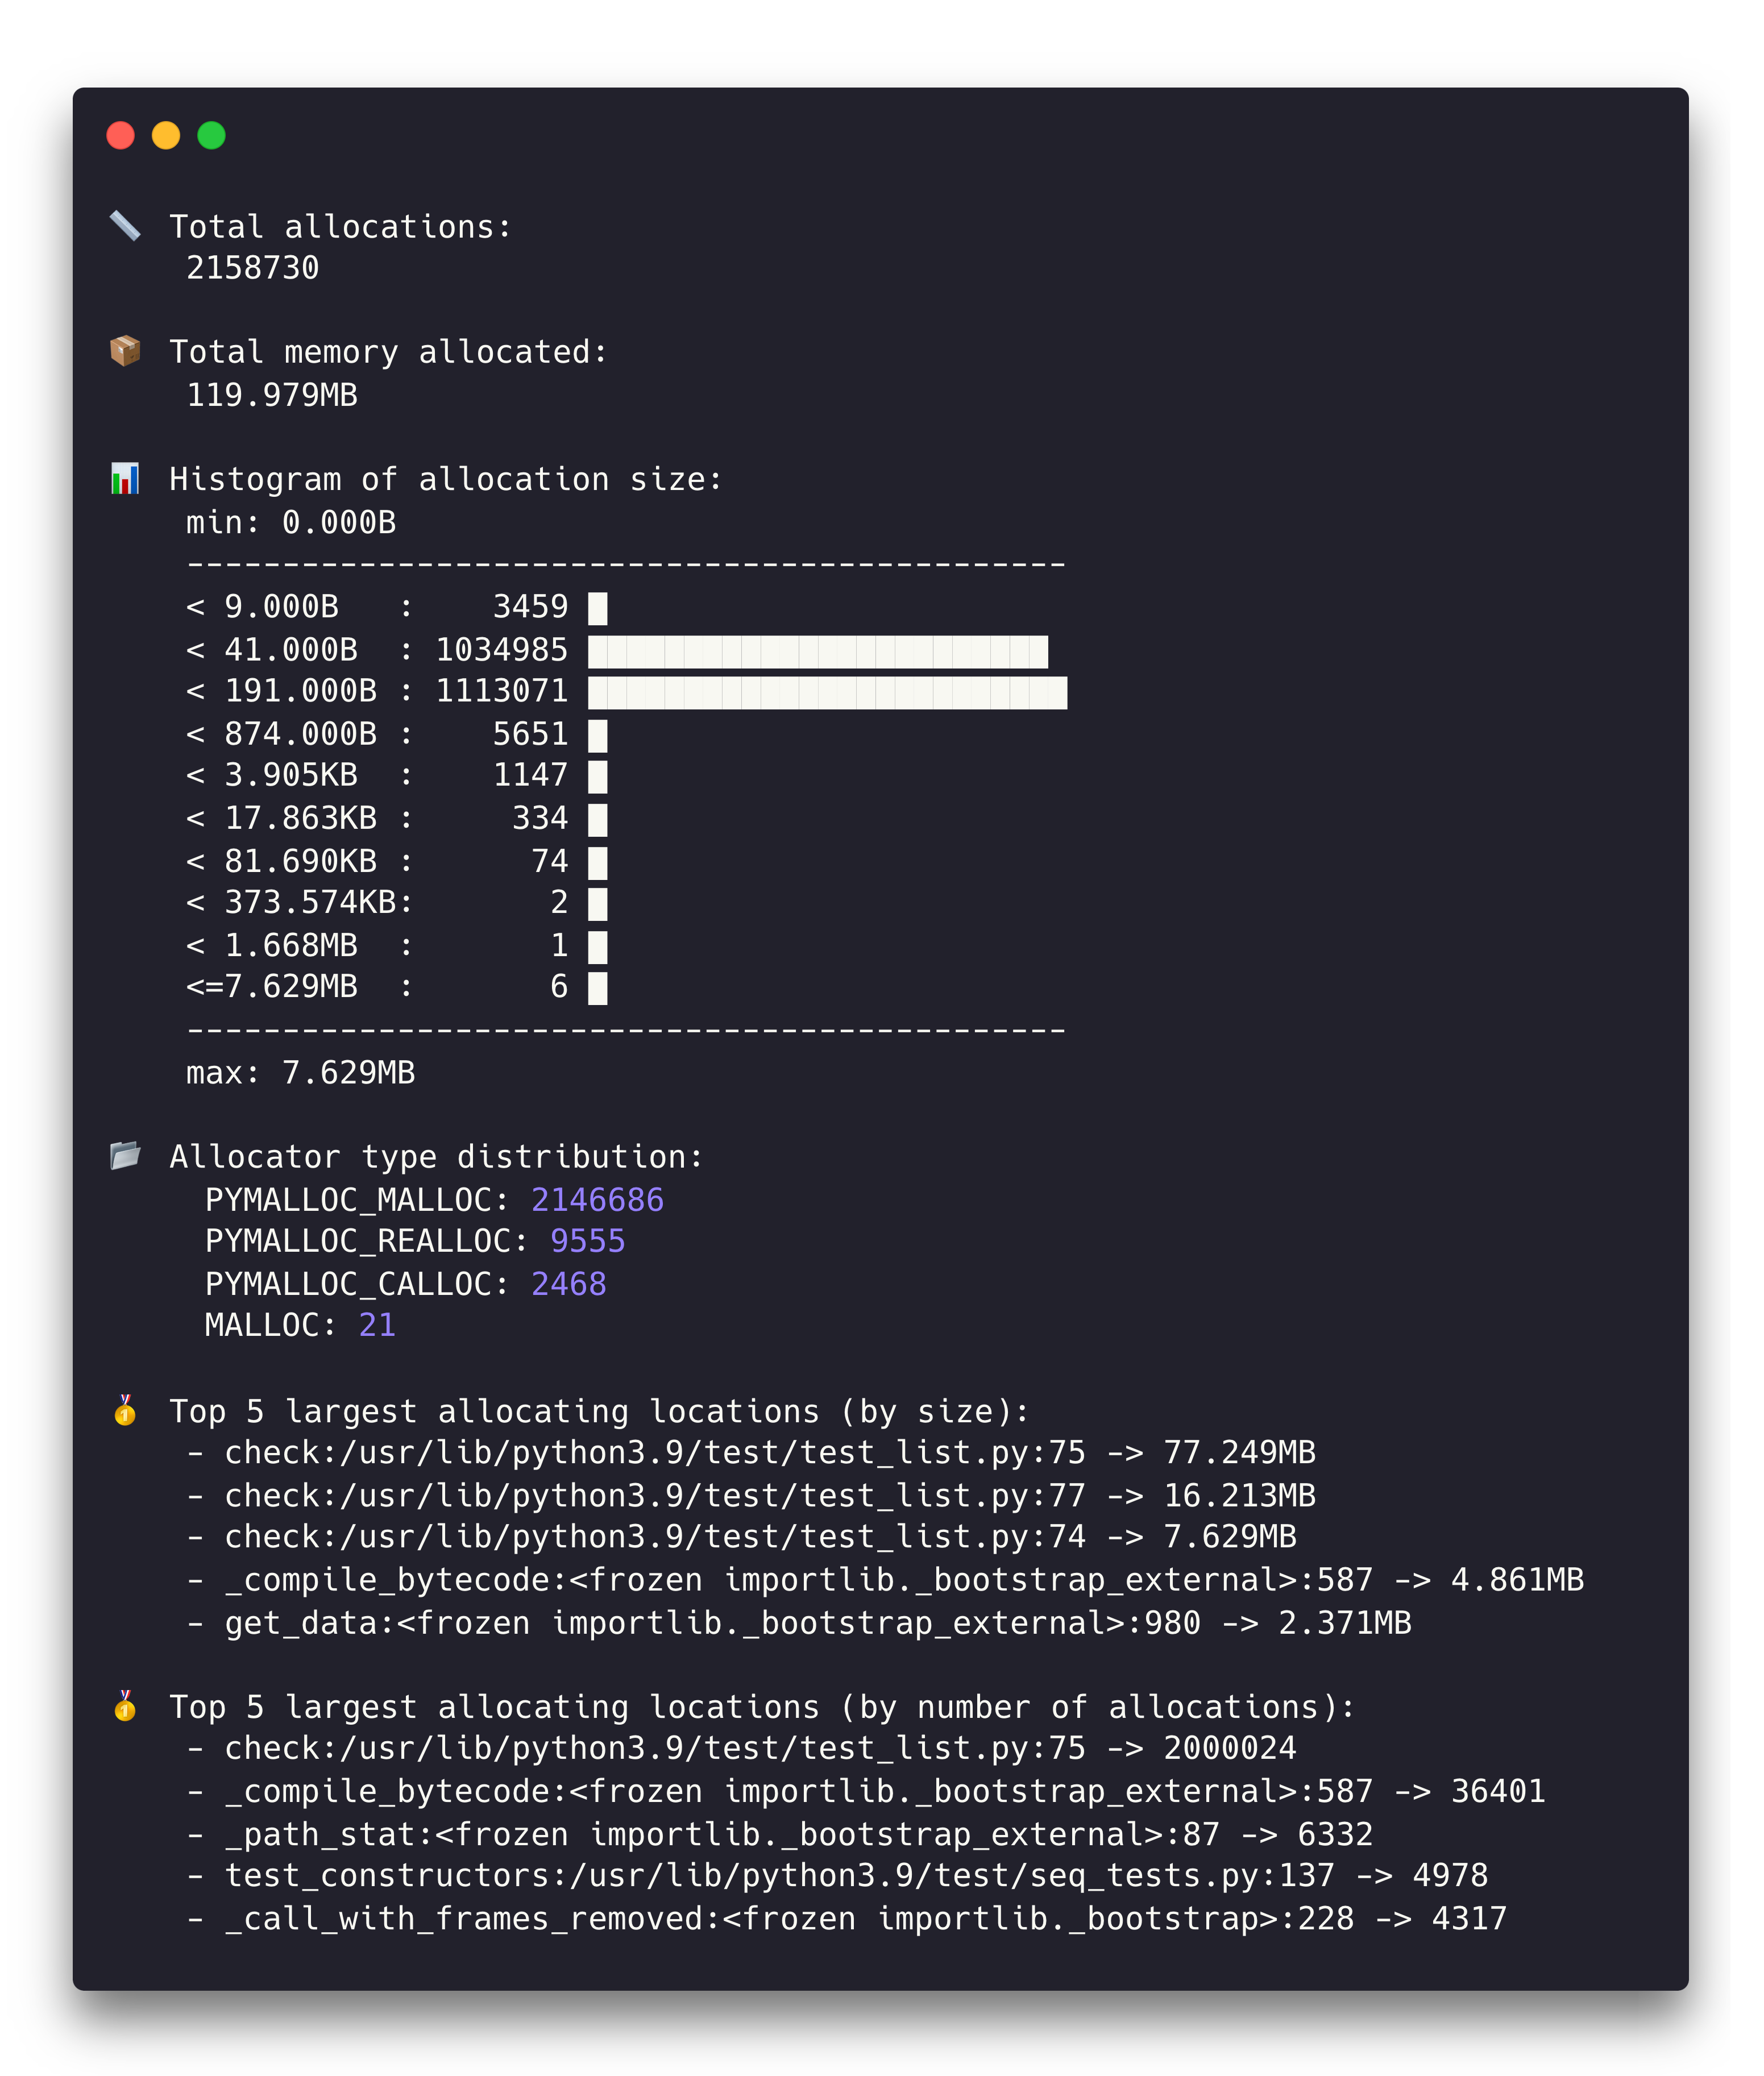
The output includes the following:
Total number of allocations performed
Total amount of memory allocated
Histogram displaying the distribution of allocation sizes. The y-axis data (size) is logarithmic.
Distribution of allocation types (e.g. MALLOC, CALLOC, MMAP, etc.)
Stack trace and size of the top ‘n’ largest allocating locations by size (default: 5, configurable with the
-ncommand line param)Stack trace and count of the top ‘n’ largest allocating locations by number of allocations (default: 5, configurable with the
-ncommand line param)(for JSON output only) Metadata about the tracked process
Basic Usage
The general form of the stats subcommand is:
memray stats [options] <results>
The only argument the stats subcommand requires is the capture file
previously generated using the run subcommand.
The output will be printed directly to the standard output of the terminal.
JSON Output
If you supply the --json flag, the stats subcommand will write its
output to a JSON file, rather than to the terminal. Like other commands that
output to files, the default output file name is based on the name of your
capture file, but it can be overridden with the -o / --output option.
By default Memray will refuse to overwrite an existing file, but you can force
it to by supplying the -f / --force option.
Note that new fields may be added to the JSON output over time, though we’ll try to avoid removing existing fields.
CLI Reference
Generate high level stats of the memory usage in the terminal
usage: memray stats [-h] [-n NUM_LARGEST] [--json] [-o OUTPUT] [-f] results
Positional Arguments
- results
Results of the tracker run
Named Arguments
- -n, --num-largest
Displays the top ‘n’ largest allocating functions. Default is 5
Default:
5- --json
Exports stats to a JSON file
Default:
False- -o, --output
Output file name for JSON output
- -f, --force
If the JSON output file already exists, overwrite it
Default:
False
Please submit feedback, ideas, and bug reports by filing a new issue at https://github.com/bloomberg/memray/issues