How we doubled BlazingMQ throughput
Published November 13, 2024
Welcome to the BlazingMQ project blog! Here, we will be posting occasional development updates and technical deep-dives into the project and improvements that we’ve been making. For our inaugural post, we’d like to share a little bit about our recent work in optimizing the BlazingMQ broker code, which has nearly doubled our throughput in some scenarios from our published benchmarks.
Overview
As with any software product, BlazingMQ evolves over time, and recently we were able to concentrate on the performance of the broker and improved the throughput numbers by 1.3x-2.0x on some scenarios. It was possible because we have invested heavily in our performance testing capabilities and now regularly run tests for BlazingMQ clusters for a variety of configurations with different numbers of nodes, different client/broker topologies, various queue types, and more. The improvements to our tooling allowed us to investigate different metrics of a working BlazingMQ cluster, understand what happens in the system better, and compare how different versions of the code perform.
 |
|---|
| Figure 1. Pending queue messages graphs of the broker before applied optimizations (baseline) and after (opt) |
For example, fig. 1 above shows the number of pending messages in the queue (y-axis) over time (x-axis) for two different broker revisions running on the same topology (i.e., the same number of nodes, brokers, clients, queues, etc.). In this plot, the blue line shows a previous version of the broker which cannot sustain 100,000 messages per second without falling behind, whereas the orange line shows the newer version of the broker containing the optimizations described in this article and can sustain at least 130,000 messages per second (note: the plot for optimized version collides with x-axis on the graph since the number of pending messages is close to 0).
To achieve this improvement in performance, we fixed several performance bottlenecks and reduced the amount of work the broker does for each message moving through the system.
Is it easy to find a bottleneck? Sometimes you can look at a call graph from a profiler (we used perf in our runs) and immediately see calls that should not be there or calls that take way more CPU time than they should. But there are also more complex or subtle bottlenecks, and finding them often requires a deeper understanding of the components in the system, how they interact, and how they interact concurrently.
To show that concurrency is a real concern, let’s have a brief look at the BlazingMQ threading model. There are threads dedicated to different roles (actors) in the broker:
Queue threads, to process user queues.
Cluster thread, to process cluster-level events.
Session threads, to manage direct connections to clients connected to this node.
Cluster channel threads, to manage direct connections to other nodes in the cluster.
IO threads hidden in the network library.
Various work threads.
To deliver a message from producer to consumer, it must go through all code paths for all actor types. Since BlazingMQ is designed for consistency, the message needs to be replicated, so it also goes through across all the same code paths in each replica node.
A bottleneck can be anywhere. Even more frustratingly, once you fix one the next biggest bottleneck may appear in a completely different part of the codebase Let’s look closely at some examples, how we fixed them, and what are the new benchmark numbers.
Hash function update
BlazingMQ’s fundamental abstraction is the message queue. But where do we actually store message queues in the code? We do this in mqbs::FileBackedStorage::d_handles. This field has type bmqc::OrderedHashMapWithHistory, the central data structure we use for message delivery. While this type provides some additional indexing for efficient iteration by insertion order and duplicate detection, at its core it’s just a hash map.
In this hash map, we store iterators to records related to a given message. Each message in BlazingMQ has its own unique 16-byte identifier of type bmqt::MessageGUID, and we use these GUIDs as keys in the hash map.
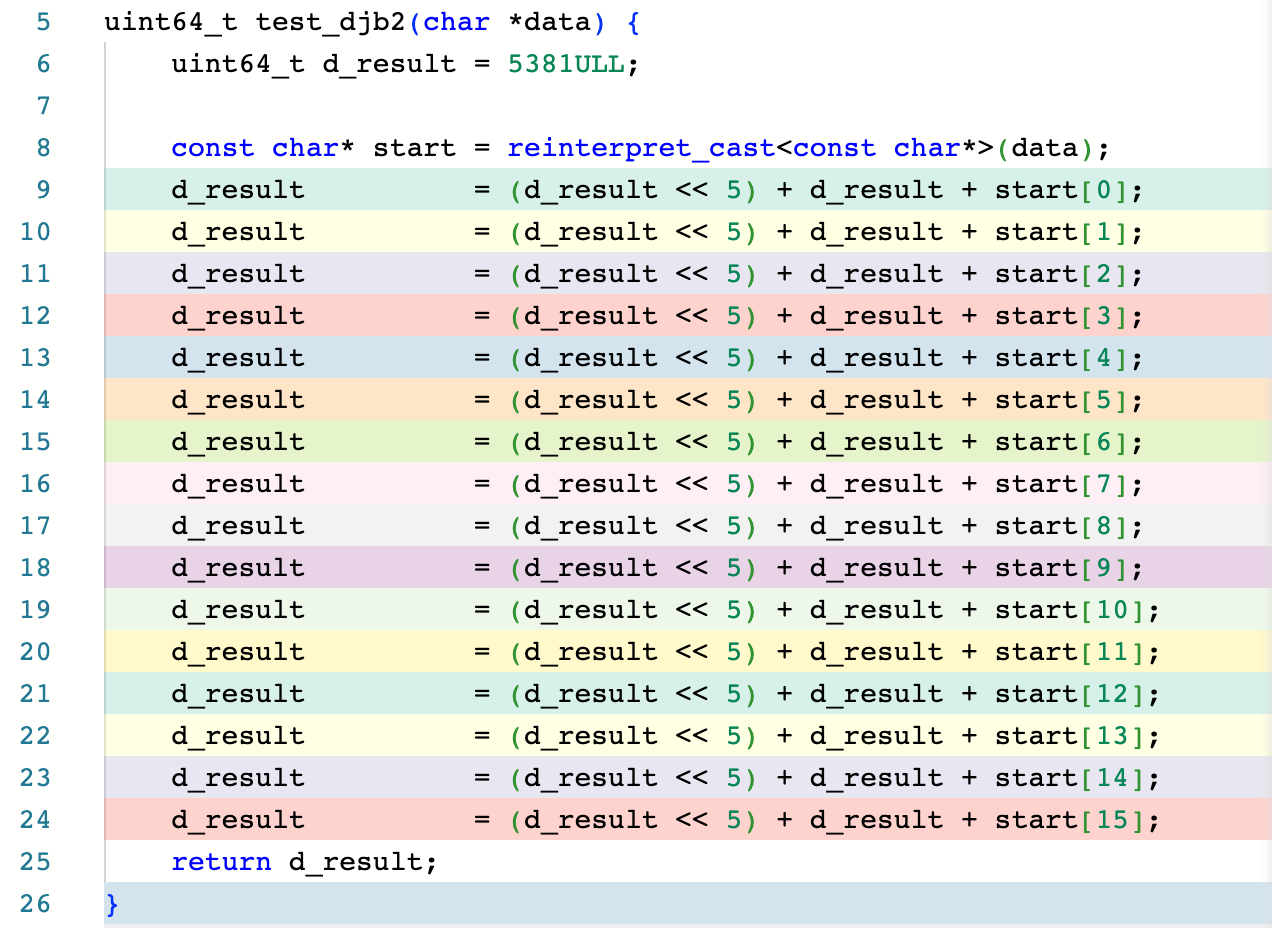
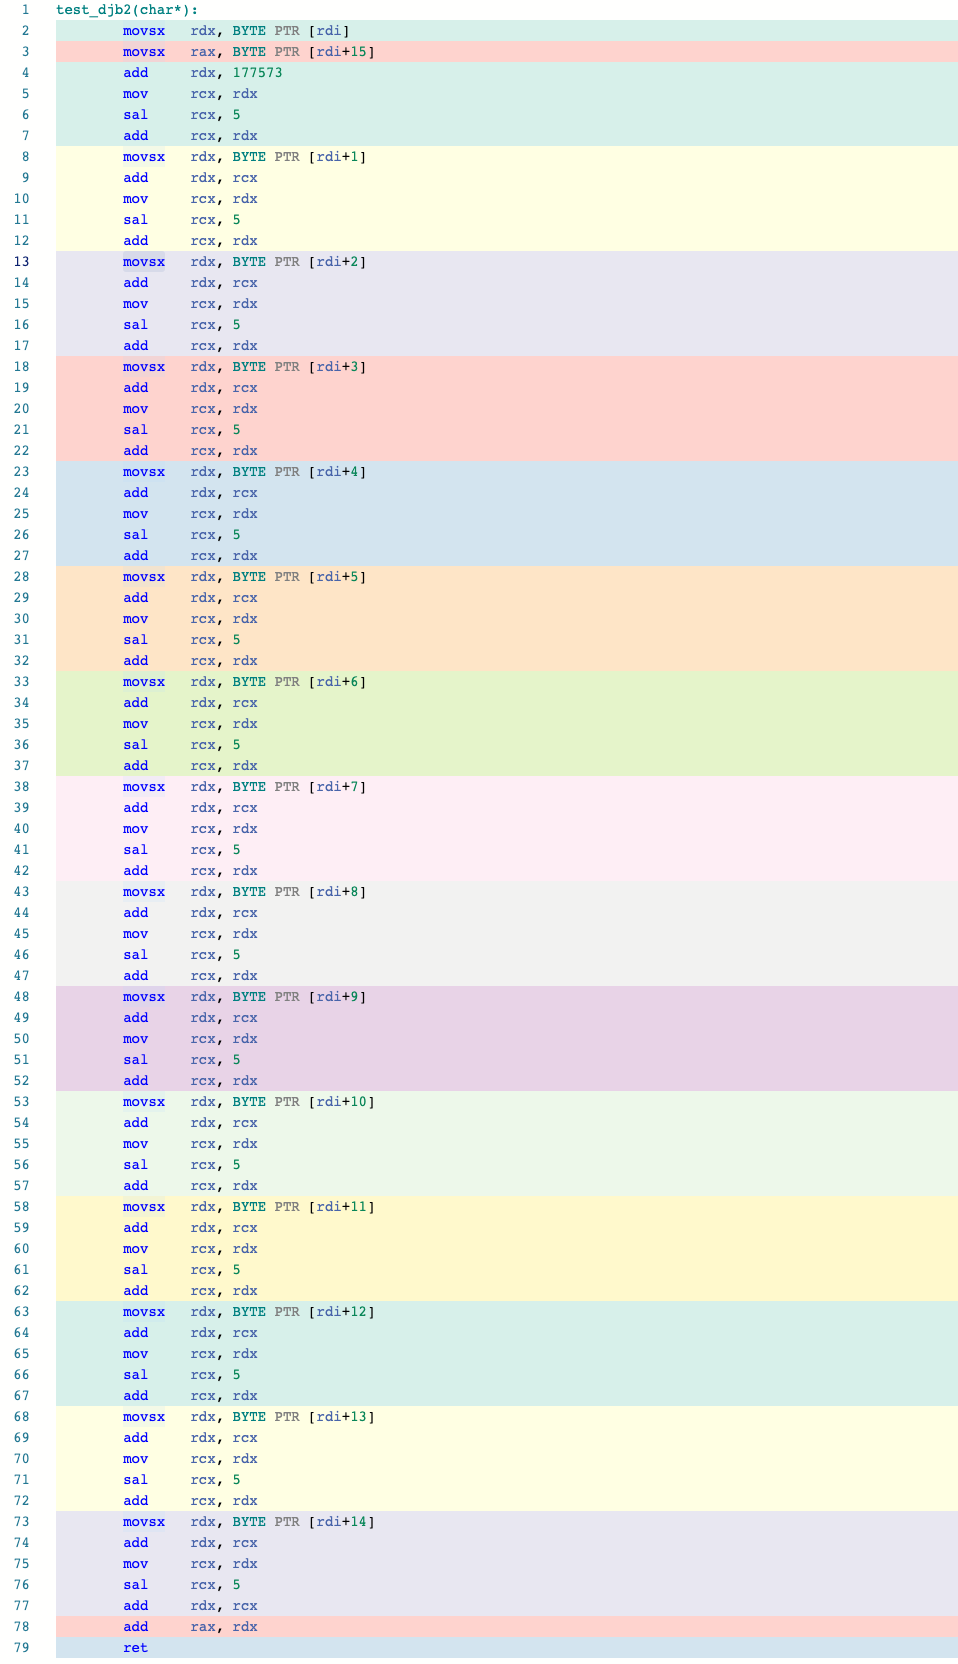
The choice of this hash function is critical for the broker’s performance, since we compute it multiple times for every message. We analyzed our legacy hash function (a hash function known as djb2) for GUIDs and found two major concerns. First, djb2 is calculated byte by byte with strong data dependency between iterations. This means that we block CPU instruction level parallelism and “touch” just one byte at a time rather than use modern CPUs’ capabilities to perform computations in multi-byte registers. Second, the hash function just didn’t do a good job of generating randomly-distributed hashes out of our GUIDs. Frequent hash collisions are bad for performance of a hash map, and we found proof that some GUID distributions produce many collisions with the legacy hash function. Ideally, we want a fast hash function that provides more random results than we observe with djb2, or at least one that is less susceptible to collisions with certain GUID patterns with similar performance.
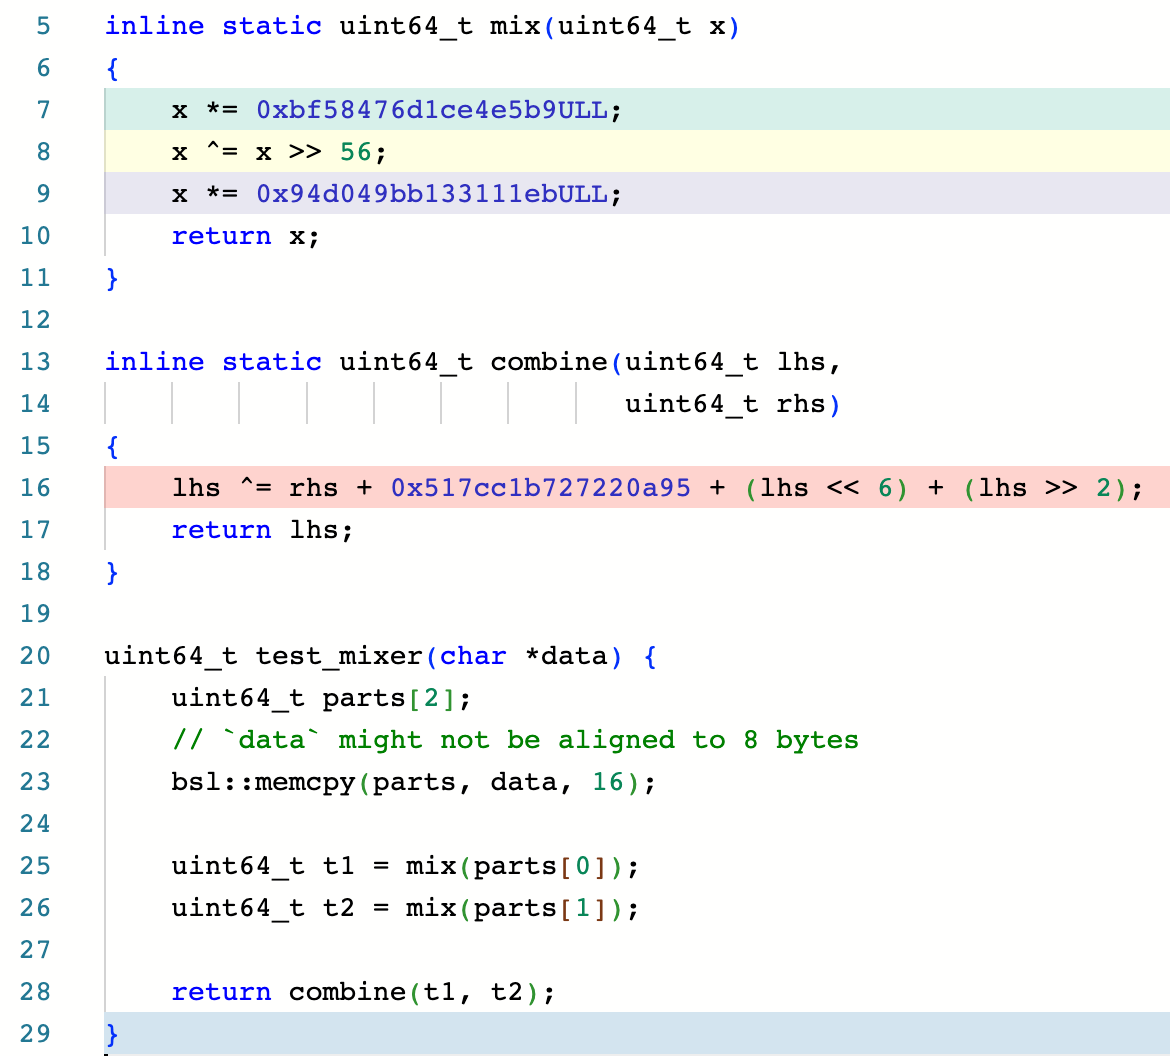
We researched and evaluated a variety of other hash functions and various implementation tradeoffs. We wanted a simple solution that did not introduce extra dependencies to the codebase, and since we know the input to the hash function is a GUID, we can use a hash function tailored to small inputs. From our research and benchmarking, most general-purpose hash functions were suboptimal in terms of performance (even if they produced decent hashes), but using a bit mixer as a hasher looked promising. Bit mixers (or finalizers) are functions that are applied to the hash result as the last step of a general-purpose hash function to introduce more entropy (also called the avalanche effect) to the result. A great blog on bit mixers we took inspiration from is here.
Bit mixers have a common limitation: they don’t narrow down the data stream bitness, since it’s not their purpose. The bit mixer we chose expects an 8-byte argument and returns an 8-byte output. To compute a hash for 16-byte GUID, we apply the mixer to the first and the last 8 bytes separately, and then combine the results of these operations.
The results of the proposed bit mixer approach are:
It shows 1.5x-4x increase in hashing speed compared to the legacy hash function used in the broker, depending on the build configuration.
It is also slightly faster than the fast general purpose xxHash in our benchmark, because we use the prior information about GUID size.
The hashing distribution also improved: our unit test for our hash function previously allowed for (and expected) a few collisions in a sequence of GUIDs, and now we don’t observe collisions in this test at all.
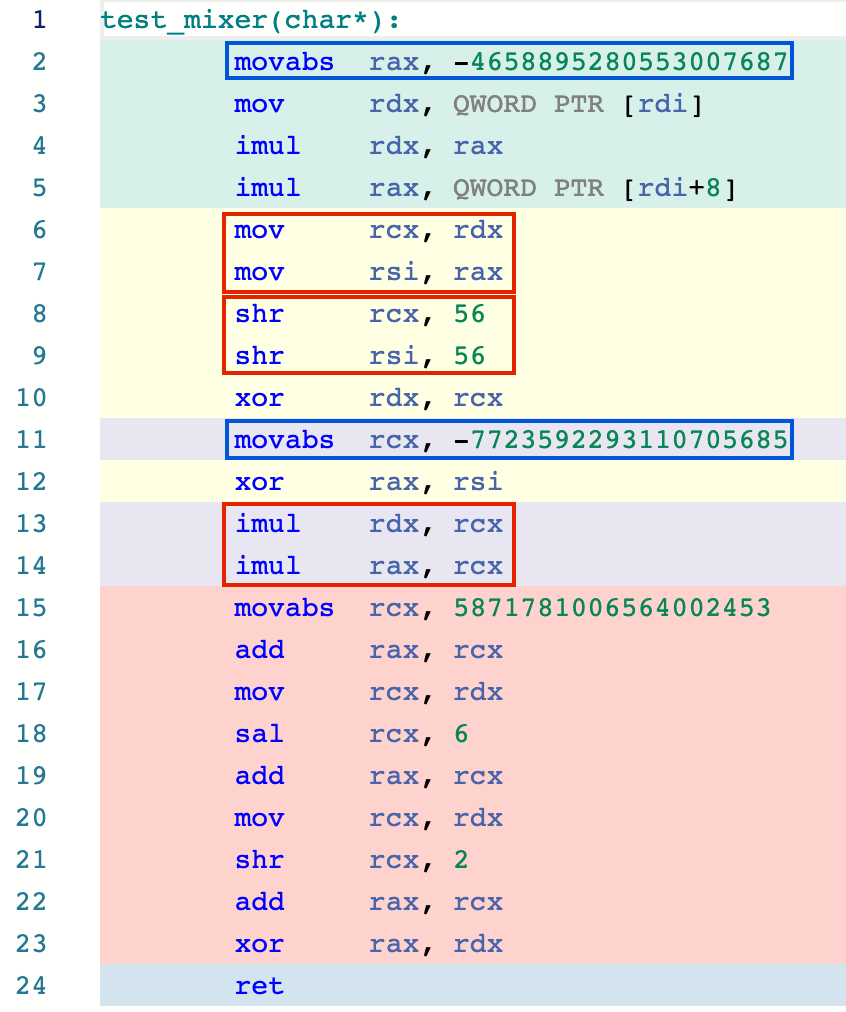
Comparing the djb2 and new mixer hash function implementations above, we see the assembly code for the mixer hash function is much shorter and makes better use of the available registers. If you look at fig. 3b, in blue rectangles you can see constants of the two subsequent mix calls being reused, and in red rectangles you can see operations from these two mix calls reordered and placed together so the CPU might execute them at the same time.
As a result of this change, the cluster can handle ~5-10% higher message throughput rates (depending on consistency, cluster topology, etc).
More details about this change can be found in PR #348.
Temporary objects on critical paths
This class of performance problems is easy to overlook during development, and easy to find with a profiler. For every message going through a messaging system there is an amount of absolutely necessary work that needs to be done to deliver it. There is also some work that is done to prepare to do this work like initializing needed structures and packing and passing information between threads. This side work might be unnecessary or expensive in some cases, especially if it involves allocating temporary memory or constructing complex temporary objects. If this temporary work is performed for every message, its impact on performance becomes noticeable. Worst of all if it happens in the busiest thread on the primary node, it directly limits the throughput of the entire system.
The best way to prevent this is either to avoid expensive allocations and needless initialization, or barring that, to cache temporary objects to reuse them if possible. Each situation requires a different strategy. Sometimes, we make sure to use stack-constructed objects without extra allocations, while in other places we cache temporary “child” objects in a parent object so they can be reused.
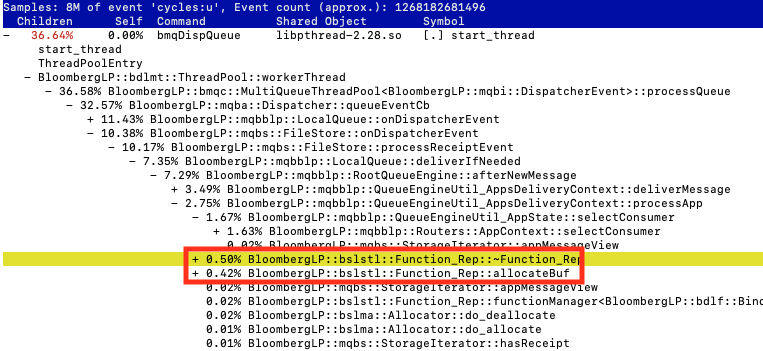
An illustrative example of this problem can be found in PR #477. Message routing happens in the queue dispatcher thread, where mqbblp::QueueEngineUtil::selectConsumer is called to select a consumer to route each message to (this is part of BlazingMQ’s core routing logic). Every call to this function constructed a temporary callback on the fly, as you can see below in fig. 4.
This temporary object turns out to be surprisingly expensive: it takes ~1% of all CPU time in our benchmark. However, the callback’s arguments never change, so we can construct the callback once, cache it, and reuse it for every message. The queue dispatcher thread now takes fewer cycles to process each message, resulting in higher throughput.
Concurrent object pools
Though building temporary objects should be avoided if possible, in some situations they are required. If constructing such an object is expensive, object pools might be used to store and reuse these objects without calling constructor and destructor each time, and to prevent extra allocations on the heap if an object requires dynamic memory. In BlazingMQ, we use shared object pools for several commonly used object types.
Shared object pools are thread safe and can be used across different threads. They have a constructor function to build new objects of the needed type and provide an interface for the user to request an item from the pool. When the user requests an item, the pool will return a previously constructed object from its collection of available objects (thereby reusing the object), or construct the item (potentially as a batch of items) if there are none available. Thread safety of a shared pool is ensured by using atomics in the first case and using mutexes when we build a new batch of items in the second case.
When a broker starts, it needs some time to warm up and populate these object pools. Once these object pools contain enough elements in circulation, the mutex path will be called much more rarely, and the non-blocking path with atomics will be used almost all the time.
But even “non-blocking” is somewhat vague, because different non-blocking algorithms will make different guarantees. The strongest is wait-free guarantee, when all threads accessing a resource will acquire it within a limited time. The lesser guarantee is lock-free, in this case threads are not guaranteed to acquire a resource within a limited time, but at least they are not fully blocked and might do some other work if they don’t acquire the resource.
The shared object pools we use in BlazingMQ are lock-free, but not wait-free. This means that the more competition we have between different threads over a pool, the more time we waste on these threads waiting. However, the performance impact is difficult to measure since we don’t know if calls to the shared object pool are getting slow with the current frequency of requests due to concurrency or if we just call it very often and this amount of work is just necessary.
To test this, we prepared an isolated benchmark where we access the same thread pool from 10 different threads to fetch and return an item. We tested different frequencies of fetching these items, and found out that on 100 microsecond delays between calls there are no observable loss in performance, but on 1 microsecond delays the overhead not only becomes visible, but huge, slowing down the benchmark application. Due to the test design, we allocate the needed number of items with just a few iterations and just reuse them after, so the culprit of the performance degradation is from lock-free atomics and not the mutex path. If we modify this benchmark to make threads use independent object pools, the observed slowness disappears.
We decided to reduce contention between threads using shared object pools in BlazingMQ. In PR #479 we made independent object pools per mqbnet::Channel objects.
From the PR’s benchmark, making these object pools independent increased the speed of fetching and returning an item by 50%. From the absolute numbers, it removes 0.7% of the total number of stack samples per every mqbnet::Channel, so, with 5 other nodes in a cluster it removes roughly 3.5% of the total CPU time used by the broker. Note that at higher message frequencies the performance degradation on concurrency will be even higher, so this change extends the throughput limits in the future. Also, we are more certain that we don’t have an invisible bottleneck here.
Our strategy to reduce contention is not free, because we don’t actually share objects between object pools dedicated to different threads – we had to allocate these objects independently in their own pools and use more memory. On this tradeoff, we decided to reduce contention anyway. There are several other global shared object pools that we use in the broker, and we have an ongoing effort to replace them with per-thread ones instead.
Allocations
Most of BlazingMQ components are allocator-aware, and we use this quality to pass a custom allocator through the entire construction call chain from the application top level. In a normal workflow we use our custom bmqma::CountingAllocator. This allocator allows us to construct nested counting allocators in a tree-like structure and report allocation updates up the tree to the root allocator. With this we have the ability to set up an internal memory limit and stop the application gracefully if we exceed it. We collect statistics for allocations in this tree, so we know how many allocations different components of the system have made and how many bytes have been allocated.
These features are very convenient, but they are not free. In fact, the underlying allocation and deallocation calls within this allocator accounts for only ~1/10th of work, the rest being the overhead of updating statistics and checking memory limits.
Since the counting allocator provides a lot of value, we didn’t want to move away from it in order to improve performance. Instead, we found all the places where allocations were done often and carefully fixed them by caching these objects or using object pools. Some of the changes described previously reduced the number of allocations, but there were other code paths where unnecessary allocations occurred.
 |
|---|
| Figure 5. Number of allocations in the broker before applied optimizations (baseline) and after (opt) |
We fixed several places where unnecessary allocations took place, and reduced the total number of allocations/deallocations in the broker. The same-scenario comparison of the old broker version and the optimized one is on fig. 5. In this scenario, we reduced the number of allocations by ~2.5 times, and it saved us CPU time, especially on the performance critical data path.
These plots also show that the number of allocations in the application is linear to time and is also linear to the total number of messages processed by the cluster. In the sample scenario, there were 21,000,000 total messages sent in a duration of 5 minutes, so on average we had ~4 allocations per message before, and ~1.5 allocations per message after applying optimizations.
Benchmarks
We benchmarked the changes discussed above, and found that stable throughput rates increased by 1.3-2.0x in some of our scenarios, without any increase in latency.
The benchmarks below use the same topologies and scenarios as our benchmarks. For each scenario, we provide the message rate that BlazingMQ could sustain with reasonable p99 latency. All latency numbers (median, p90, p99) in the following tables are in milliseconds.
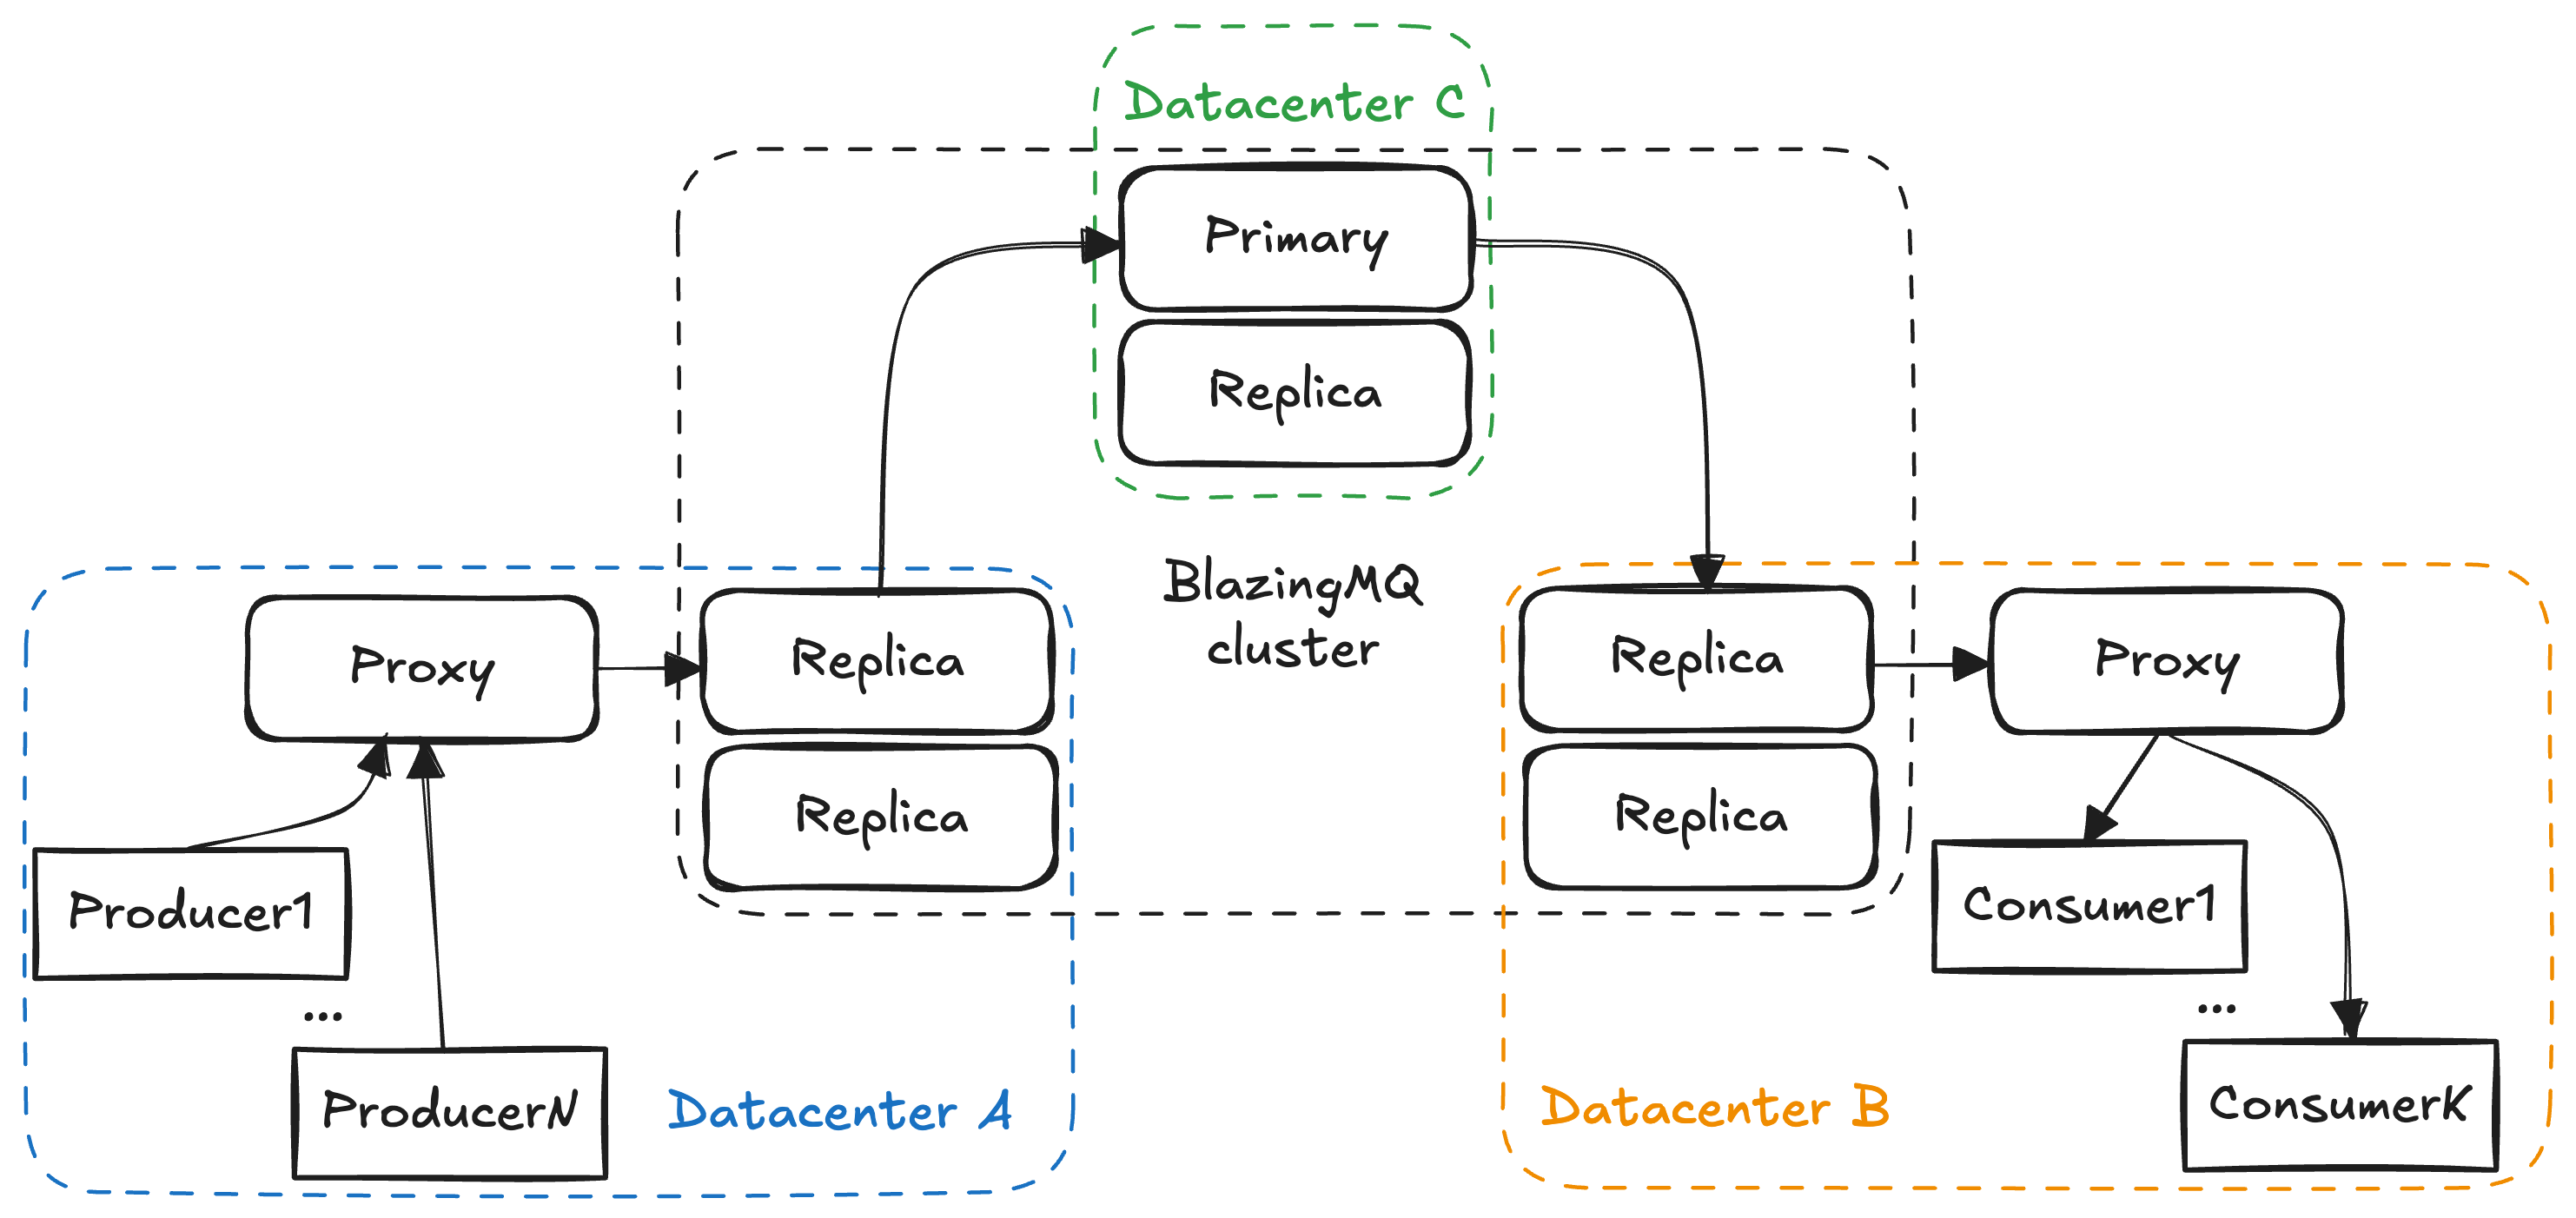
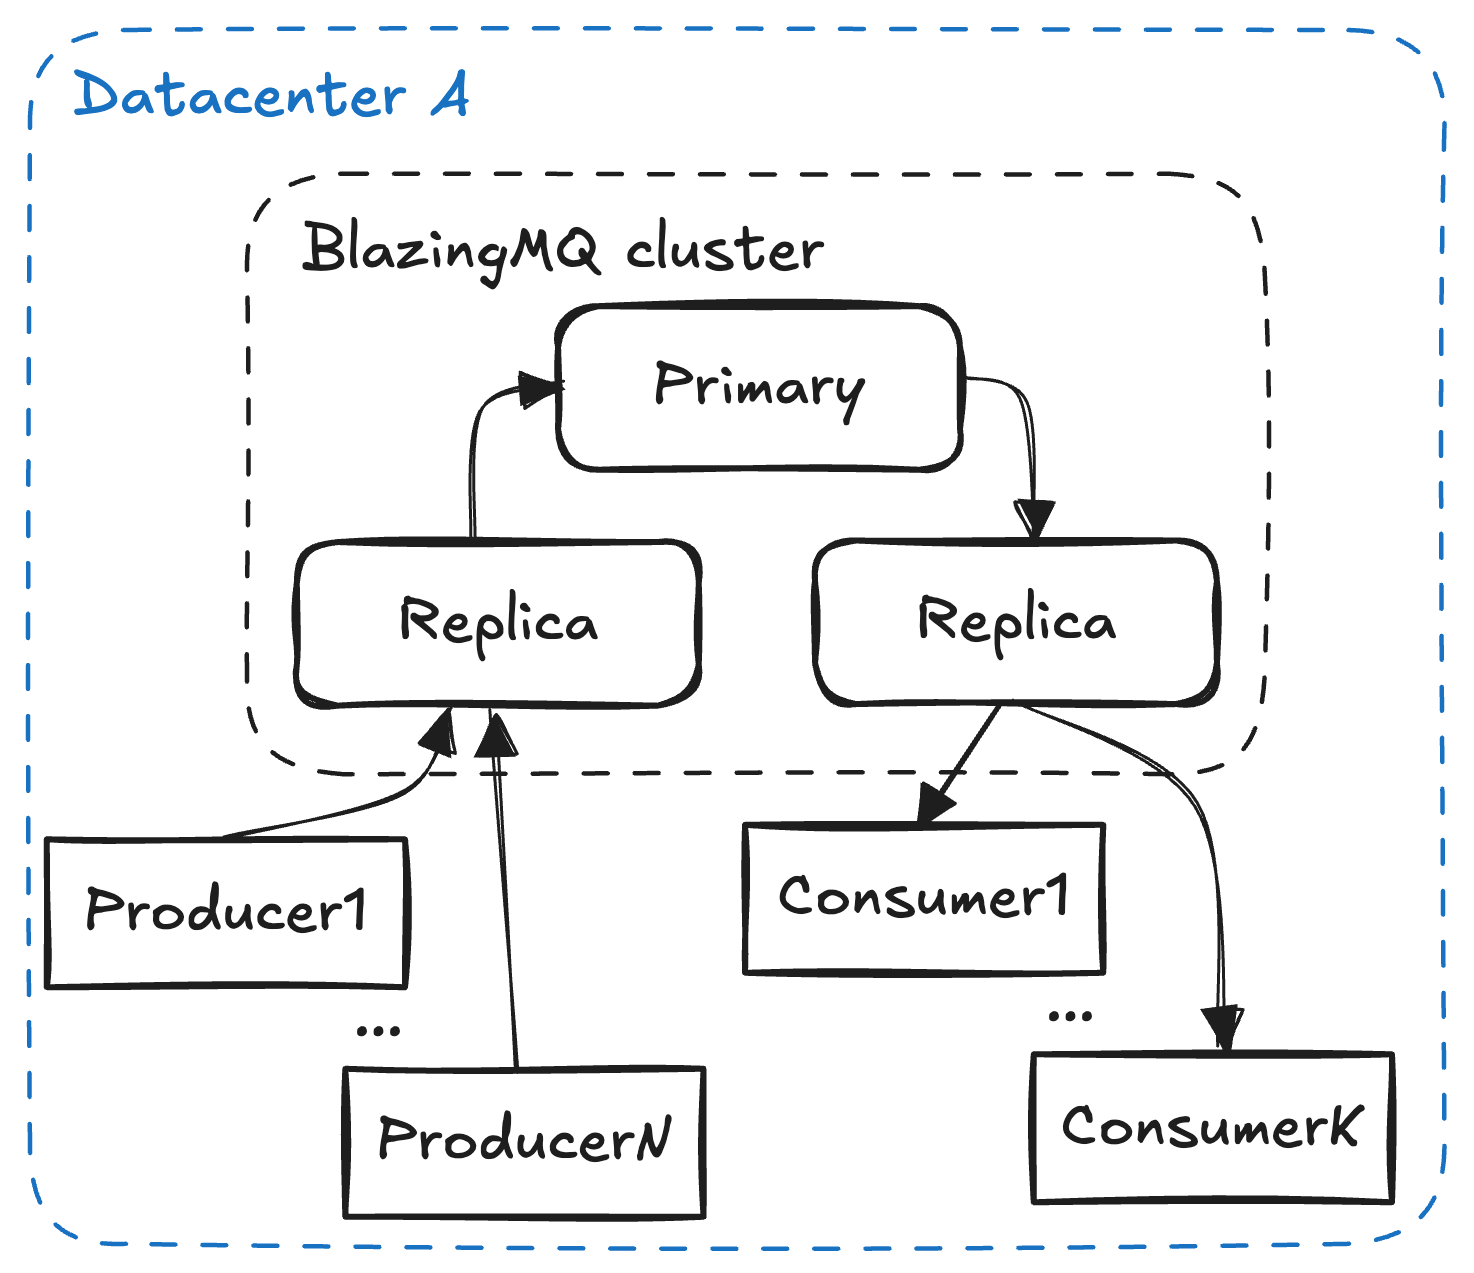
Fig. 6 and fig. 7 show the topologies used in the benchmarks. Note that queues in the max setup are configured with strong consistency, and queues in the friendly setup are configured with eventual consistency (consistency levels). Also, in the friendly setup clients have direct connection to cluster replicas, while in the max setup they connect with intermediate proxy brokers. All clients are on the same host with replica/proxy they connect to.
Priority Routing Strategy
Max setup:
| Scenario | Total Produce/Consume Rate (msgs/sec) | Median | p90 | p99 |
|---|---|---|---|---|
| 1Q, 1P, 1C | 80,000 (before: 60,000) | 4.7 | 5.1 | 18.4 |
| 10Q, 10P, 10C | 200,000 (before: 120,000) | 3.1 | 3.5 | 13.4 |
| 50Q, 50P, 50C | 200,000 (before: 100,000) | 3.4 | 3.7 | 8.2 |
| 100Q, 100P, 100C | 200,000 (before: 100,000) | 3.6 | 3.9 | 10.5 |
Friendly setup:
| Scenario | Total Produce/Consume Rate (msgs/sec) | Median | p90 | p99 |
|---|---|---|---|---|
| 1Q, 1P, 1C | 130,000 (before: 60,000) | 1.1 | 1.3 | 17.2 |
| 10Q, 10P, 10C | 250,000 (before: 120,000) | 0.9 | 1.3 | 25.0 |
| 50Q, 50P, 50C | 250,000 (before: 100,000) | 1.1 | 1.8 | 28.6 |
| 100Q, 100P, 100C | 250,000 (before: 100,000) | 0.9 | 1.4 | 30.6 |
Fan-out Routing Strategy
Max setup:
| Scenario | Total Produce Rate (msgs/sec) | Total Consume Rate (msgs/sec) | Median | p90 | p99 |
|---|---|---|---|---|---|
| 1Q, 1P, 5C | 35,000 (before: 20,000) | 175,000 (before: 100,000) | 4.7 | 5.1 | 9.7 |
| 1Q, 1P, 30C | 8,000 (before: NA) | 240,000 (before: NA) | 5.4 | 7.1 | 18.6 |
Friendly setup:
| Scenario | Total Produce Rate (msgs/sec) | Total Consume Rate (msgs/sec) | Median | p90 | p99 |
|---|---|---|---|---|---|
| 1Q, 1P, 5C | 45,000 (before: 30,000) | 225,000 (before: 150,000) | 1.0 | 1.4 | 5.9 |
| 1Q, 1P, 30C | 9,000 (before: NA) | 270,000 (before: NA) | 2.1 | 3.3 | 16.4 |
Conclusion
Improving performance doesn’t always require rearchitecting a system. Having the right benchmarks and profiling your code can lead you to surprisingly small, simple changes that have a measurable impact on the system.
In our case, benchmarking and profiling our code really paid off. After a few, mostly minor performance improvements, our throughput is between 30-100% higher in real-world benchmarks. We think there are still many simple changes we can make to improve performance, so the results presented here are merely an update to our original benchmarks published last year. We’ll be busy improving the performance of BlazingMQ. If you’re interested in helping us improve the performance of BlazingMQ, submit an issue, submit a pull request, or get in touch.

