The endgame Python stack debugger
PyStack reports the stack frames of a running Python process or a Python core dump

Processes and core files
No matter the situation, PyStack is your reliable companion for program analysis. If a process is running more slowly than you expected, PyStack can tell you what it's doing. If it's hanging, PyStack can tell you where it got stuck. If it crashed, PyStack can even tell you what it was doing from the core dump it left behind.
Ready for anything
PyStack thrives in extreme conditions, always ensuring accurate insights. It can handle deep call stacks like a breeze. It can get you a comprehensive report even if your Python interpreter is heavily optimized and shipped without debug information. Even if memory corruption has trashed some of the interpreter's internal data structures, PyStack can handle it!
Prevent regressions
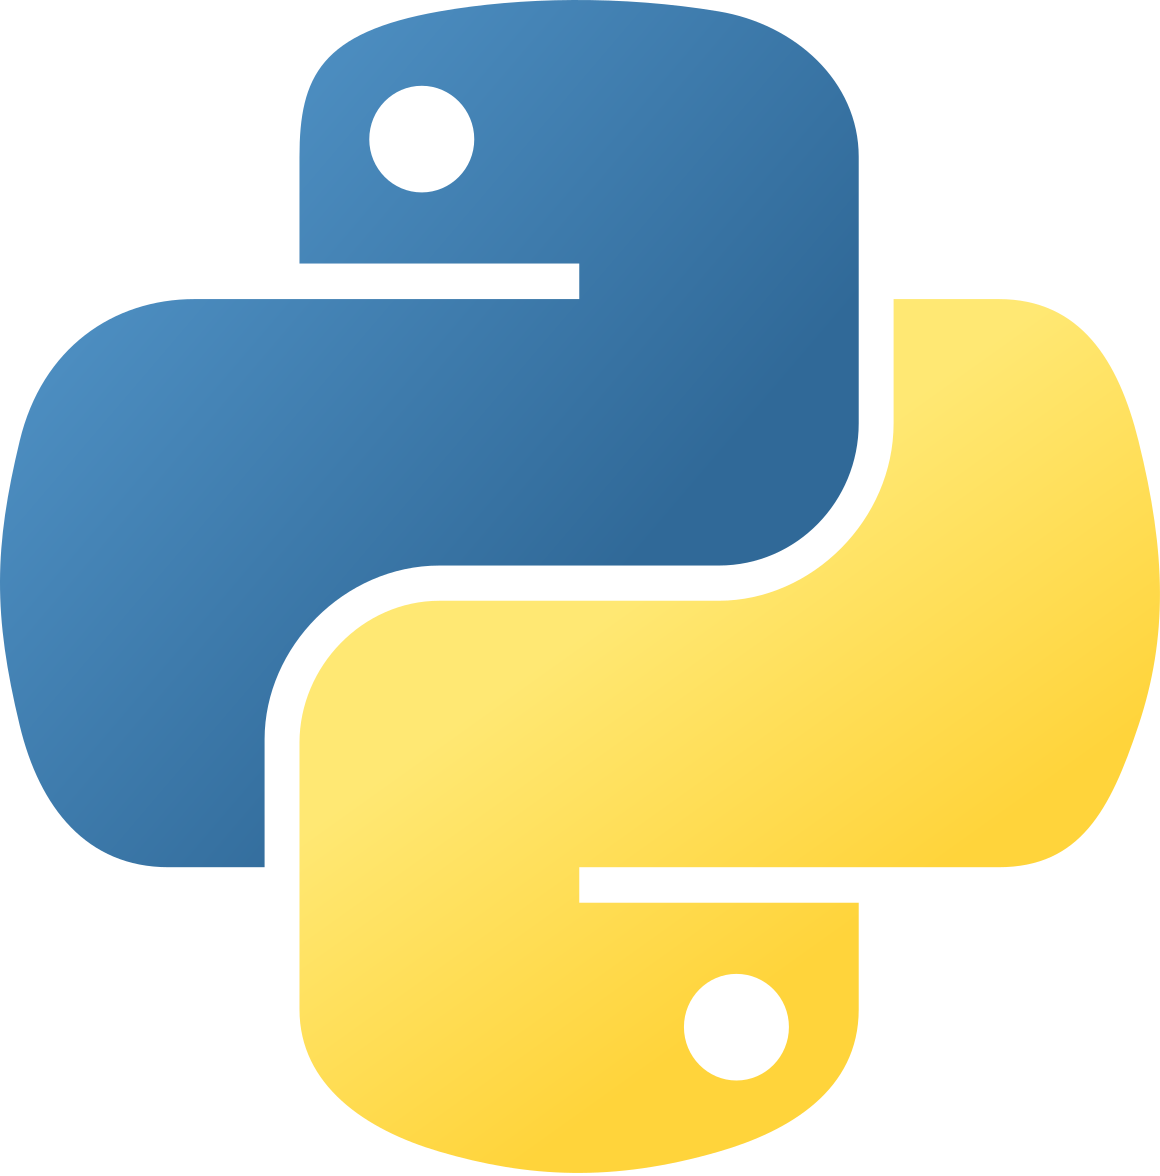
You can easily integrate PyStack into your
pytest test suite. If a test gets stuck,
our plugin can automatically report each thread's stack
and help you figure out what went wrong.
Uncover your program's secrets. No more deadlocks or mysterious crashes.
PyStack provides a powerful tool for inspecting the stack frames of a running Python process or a Python core dump. It allows developers to quickly and easily understand what's happening in their Python programs without delving into the intricate details of CPython internals. When you ask PyStack to analyze a running process or core file, it prints a stack trace for each thread, which shows the sequence of function calls and their corresponding line numbers in the Python code. This feature is invaluable for debugging and understanding the runtime behavior of an application, especially when encountering unexpected hangs or crashes.
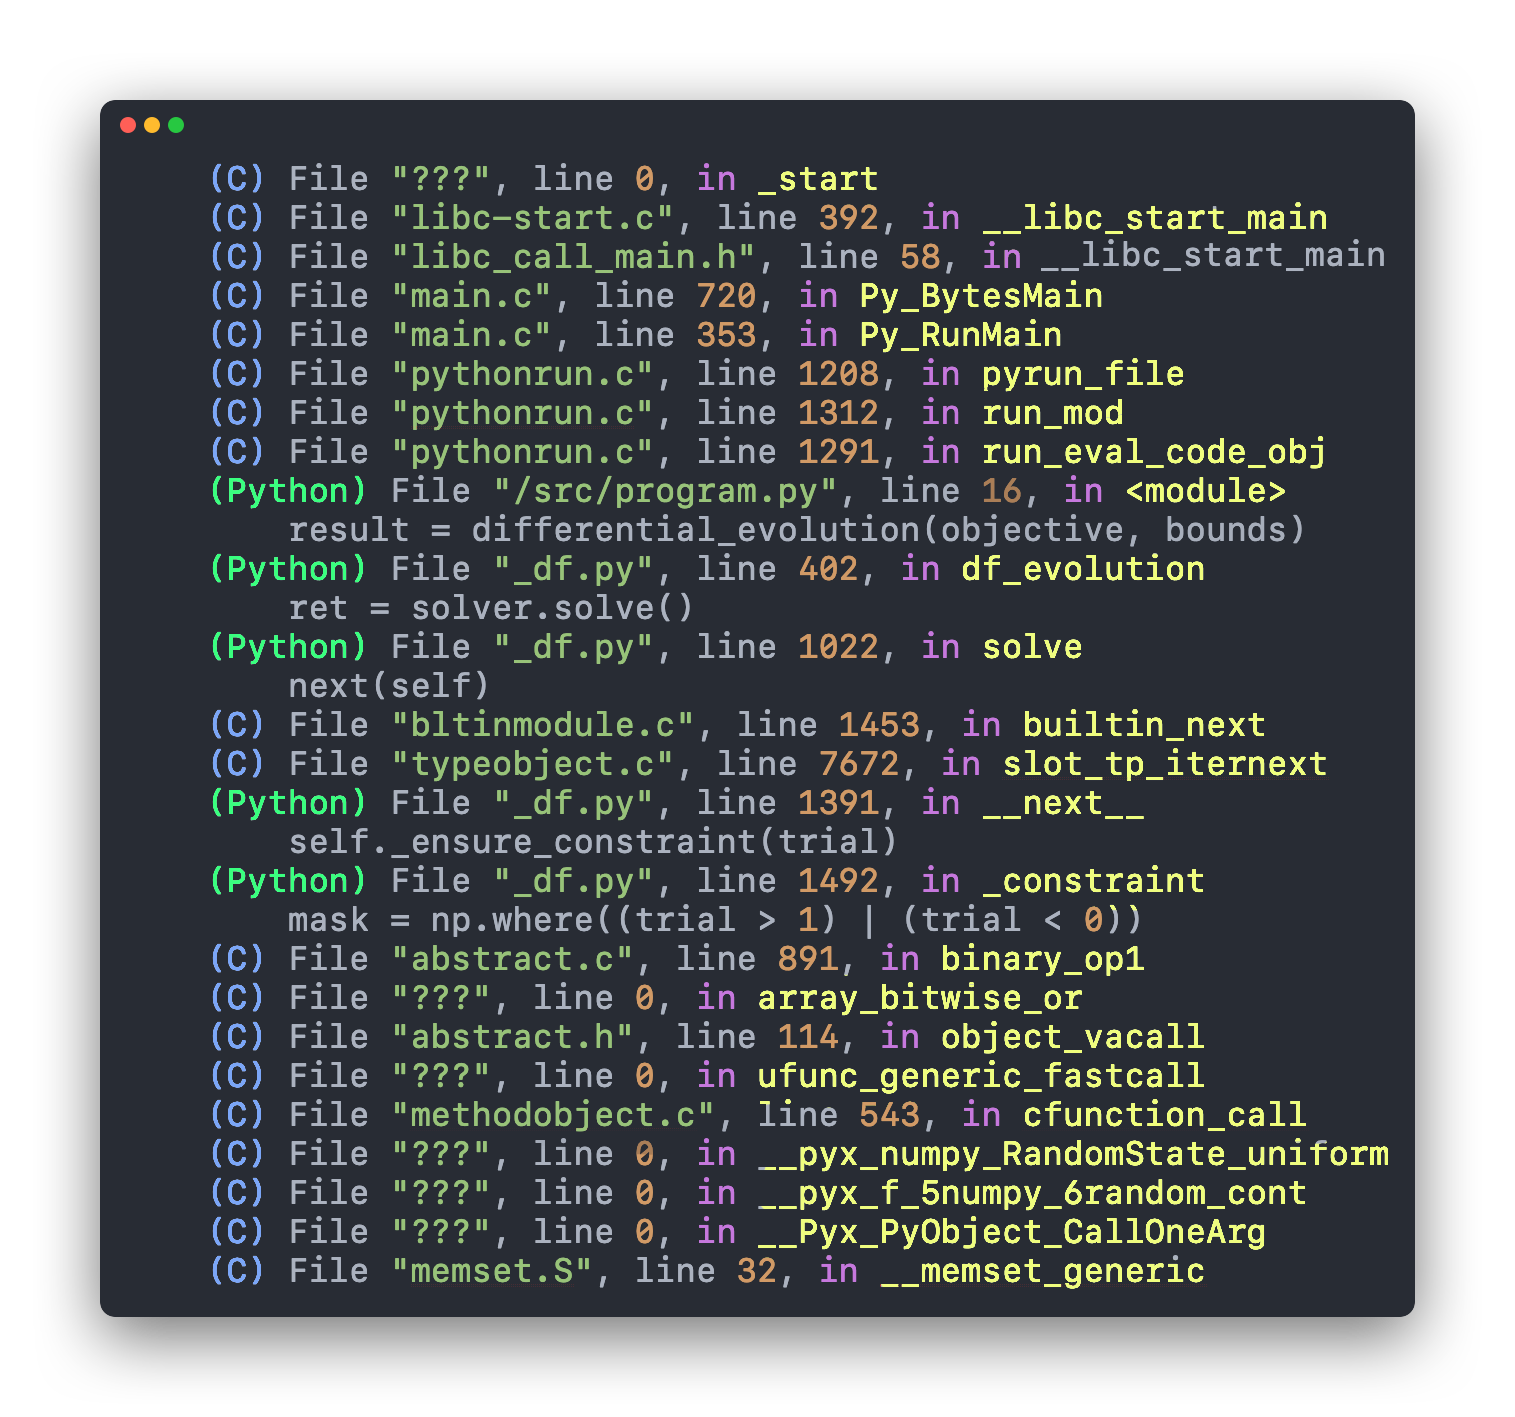
No more hidden code! Peer inside native extensions.
PyStack's native mode offers an additional layer of insight by including native function calls in the stack trace. When your Python code calls into some code that isn't written in Python, PyStack shows you what native functions are executed. If one of those functions calls a function written in Python, the reported stack will switch right back to displaying Python frames.
This mode lets developers see the full stack trace, including calls to C/C++/Rust functions, while still providing context about the Python code being executed at each level. PyStack automatically demangles symbols in the native stack, and it can even include calls to inlined functions whenever there is sufficient debug information available! Native mode is particularly useful when analyzing the interactions between Python and native code in a mixed-language application — which of course is exactly where many crashes and deadlocks occur.
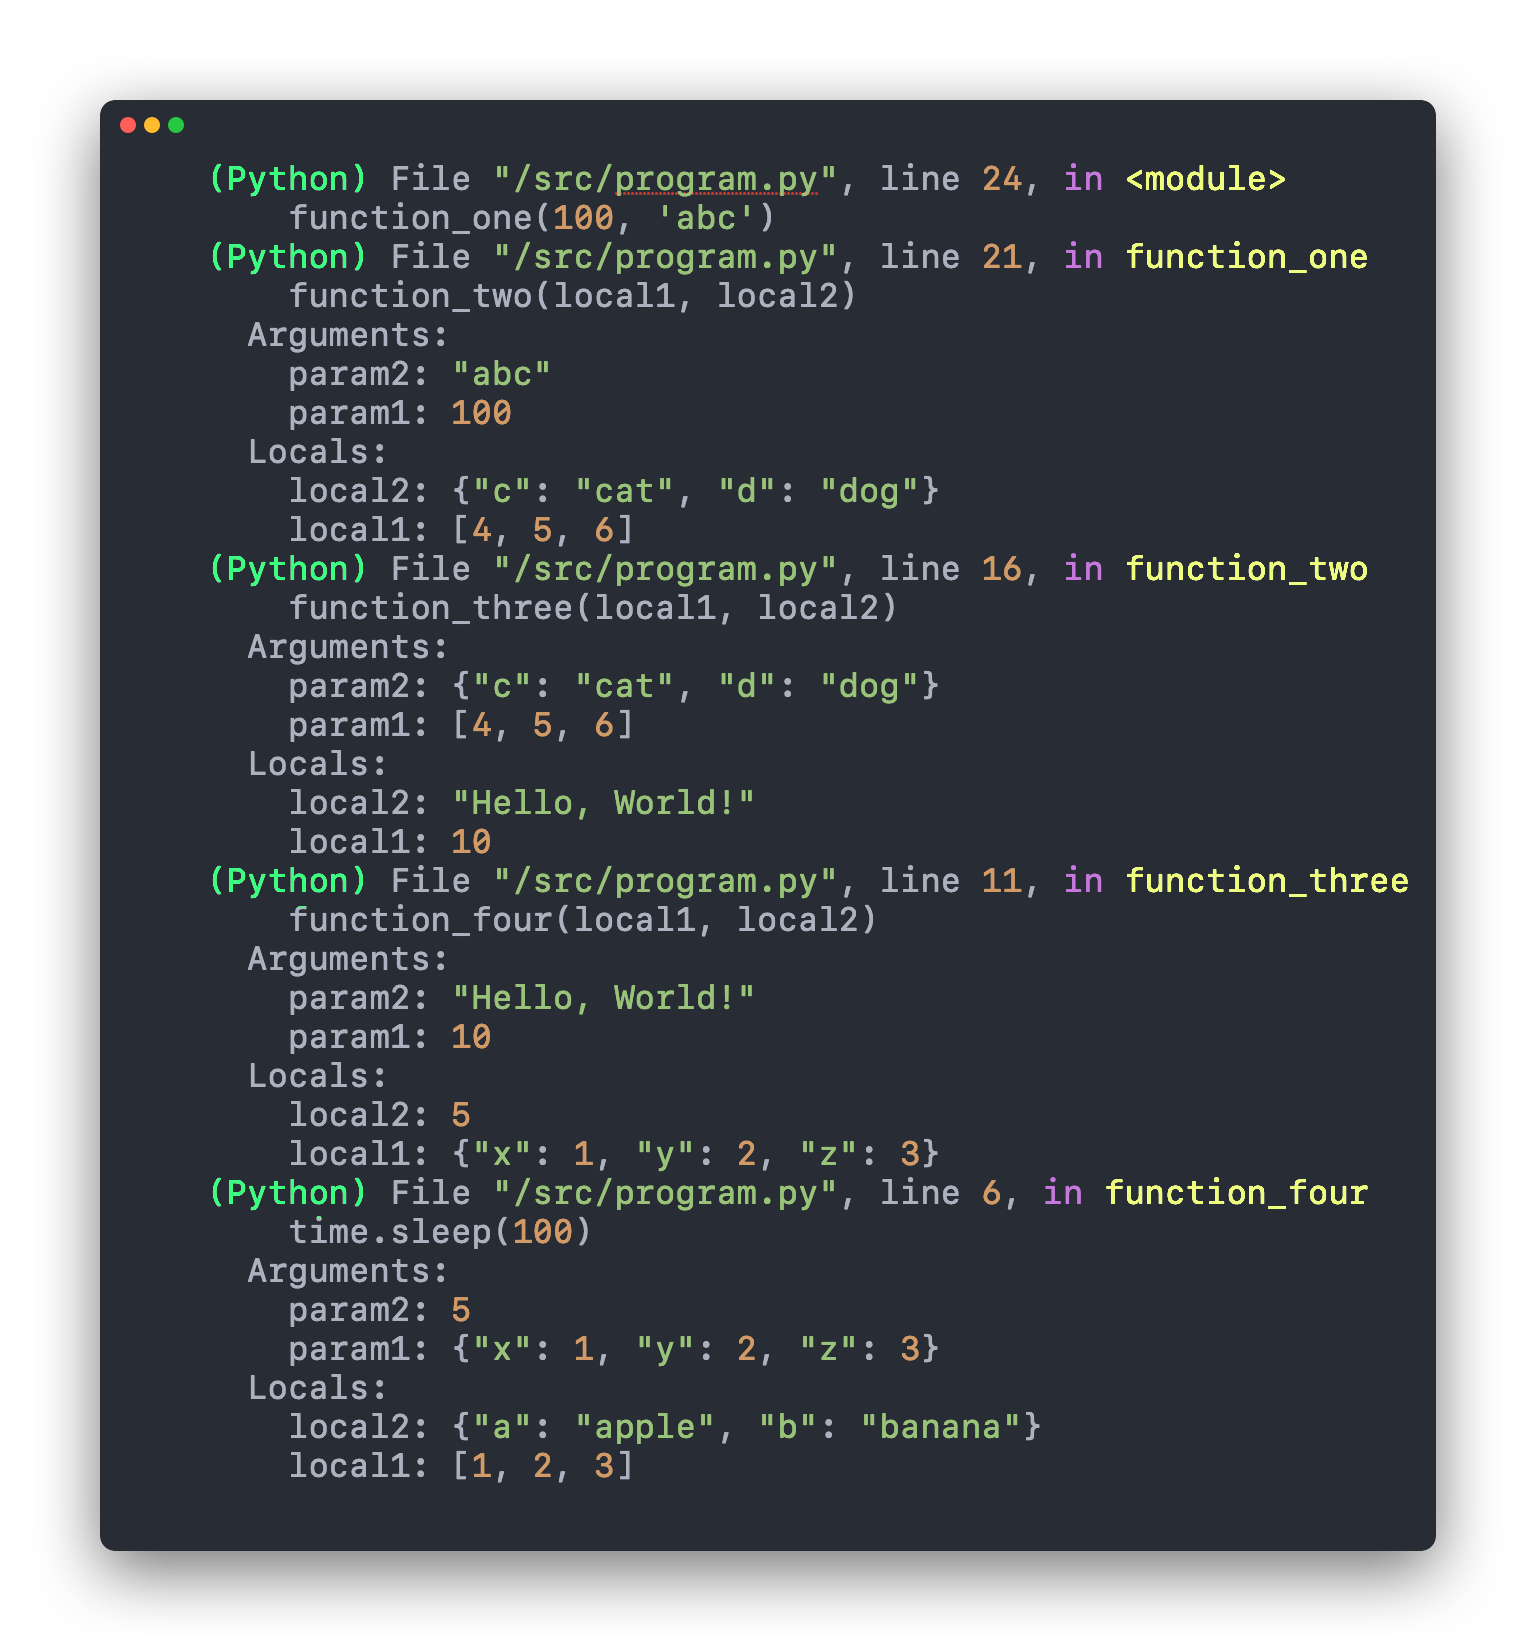
Deep Dive into Program State. See inside your functions!
You can ask PyStack to go beyond providing a stack trace, and to also print the values of local variables and function arguments within Python stack frames. This lets developers obtain a more detailed understanding of what the program is currently doing inside each call. This feature is especially helpful when trying to understand why a particular function was called, or to see what work was being performed when a process crashed. By examining the local variables and arguments, developers can gain crucial insights into the runtime behavior of their Python. This is one of the best ways to leverage PyStack's debugging capabilities to analyze your application and identify potential errors or unexpected behaviors.